If you read my last post, there’s a Wavefront proxy running on a Ubuntu server in EC2 ready to collect data, transform it, and send it to Wavefront. There is a way to create metrics from logs, and my goal is to get Pi-hole logs into Wavefront for analysis. Based on this video, there are two ways to send log data to a Wavefront proxy – using raw TCP or using Filebeat. So how does one decide?
Choosing the Right Tool to Ship Logs
From what I learned, the raw TCP option may be better suited if you have a syslog platform like Splunk in place. Interestingly enough, Splunk can forward its data to third-party systems with just a few configuration tweaks. Since vRealize Log Insight can forward event data to Splunk using TCP, I’d imagine using it for forwarding data to Wavefront could be done pretty easily as well. There are likely an array of other syslog platforms that have the same capability.
I found two helpful articles (Splunking the Raspberry Pi-hole, How to Splunk Data from a Raspberry Pi) that talked about the Splunk Universal Forwarder as an easy way to send log files and other data from a Raspberry Pi to Splunk. It appeared to be free but only after you enter a bunch of information to get a free Splunk account. Because of that I decided pause the raw TCP approach (at least for now).
Then I started researching Filebeat and came across this article for installing Filebeat on Raspbian. The author put forth a good deal of effort since there was no ARM build of Filebeat when the blog was written. I wasn’t sure I wanted to go there. This thread from the Elastic community mentions a lack of ARM support for Beats packages unless you want to install ArchLinux (Filebeat packages for ArchLinux can be found and downloaded from here). When you haven’t done something like this, how do you decide the best way to go? Ask the community, of course. Kudos to Jared Busch and others for offering some advice in this MangoLassi post.
In that post FiyaFly makes the point that there should be some other logging tool that is an installable package for Raspbian. After a little more research, it turns out there is one called syslog-ng. This post gives some detail on how it can be used to turn a Raspberry Pi into a syslog server. While I do not want to build a syslog server specifically, I need something to forward logs to my Wavefront proxy. Based on the Linux man page for this package’s config file, it looks like there’s potential to use this tool. I realized also that rsyslog comes as part of Raspbian. This post discusses some of the differences between syslog-ng and rsyslog.
Maybe you’re thinking what I am at this point. I’ve spent too long trying to choose the right tool instead of choosing one that will do the job so I can accomplish my goal. Since I spent the most time looking over syslog-ng configuration examples and it happened to be an easily installable package, that is the tool I chose. It had specific capabilities to collect log messages from files that seemed intuitive, and that’s what was needed for this project.
Installing syslog-ng on Raspbian
At this point I’m logging into my Raspberry Pi via SSH to run the installer for syslog-ng:
sudo apt-get install syslog-ng
During the install (which succeeded), I noticed rsyslog was removed. This is likely to prevent some kind of conflicting behavior since rsyslog is part of Raspbian by default.
![]()
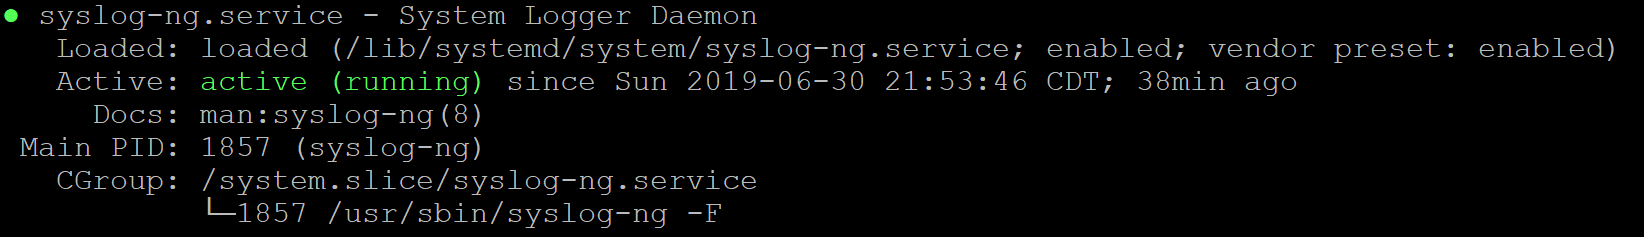
Now that syslog-ng has been installed, is it actually running? Run the following command to check.
sudo service syslog-ng status
Based on the screenshot below, the service is running. That’s progress. But at this point, it isn’t configured to monitor and send the specific log files of interest to the Wavefront proxy.
Which Log Files to Send?
Before making any changes to syslog-ng, I want to identify the specific files that will be sent to Wavefront. It appears the following log files will be the most useful for analysis via Wavefront (all currently stored locally on the Raspberry Pi). This list may change based on how things go with this project.
- /var/log/pihole.log
- /var/log/pihole-FTL.log
- /var/log/pihole_updateGravity.log
- /var/log/syslog – for optional system information
Back to the Cloud
Before we start sending logs to the proxy (a Ubuntu VM running in EC2), it would be wise to ensure all proper ports are open. According to this document, the proxy needs to be configured to accept incoming log data. I’ve restricted SSH access to the proxy to only my home network’s ip address using AWS tooling but have not opened any ports within Ubuntu. Let’s login to the proxy via SSH and look at the Wavefront proxy configuration file. Since this proxy runs on Ubuntu, the configuration file is /etc/wavefront/wavefront-proxy/wavefront.conf.
To edit the file, run sudo vi /etc/wavefront/wavefront-proxy/wavefront.conf
Then, use the proper vi commands (which we won’t get into here) to add the two lines below to the file, save it, and then exit. These lines can go just about anywhere in the file (most lines are commented out by default), but don’t make other changes at this time. Notice the path specified by the logsIngestionConfigFile parameter matches the Wavefront install directory, and we’re specifying port 5055 for syslog-ng to use as a target for raw TCP logs. The yaml file can technically be named anything we want and does not exist until manually created (to be done later). This function of this file is to take specific data from the log files you are sending and turn it into time series metrics for analysis in Wavefront. Think of it as a blank slate for now.
rawLogsPort=5055

logsIngestionConfigFile=/etc/wavefront/wavefront-proxy/logsIngestion.yaml
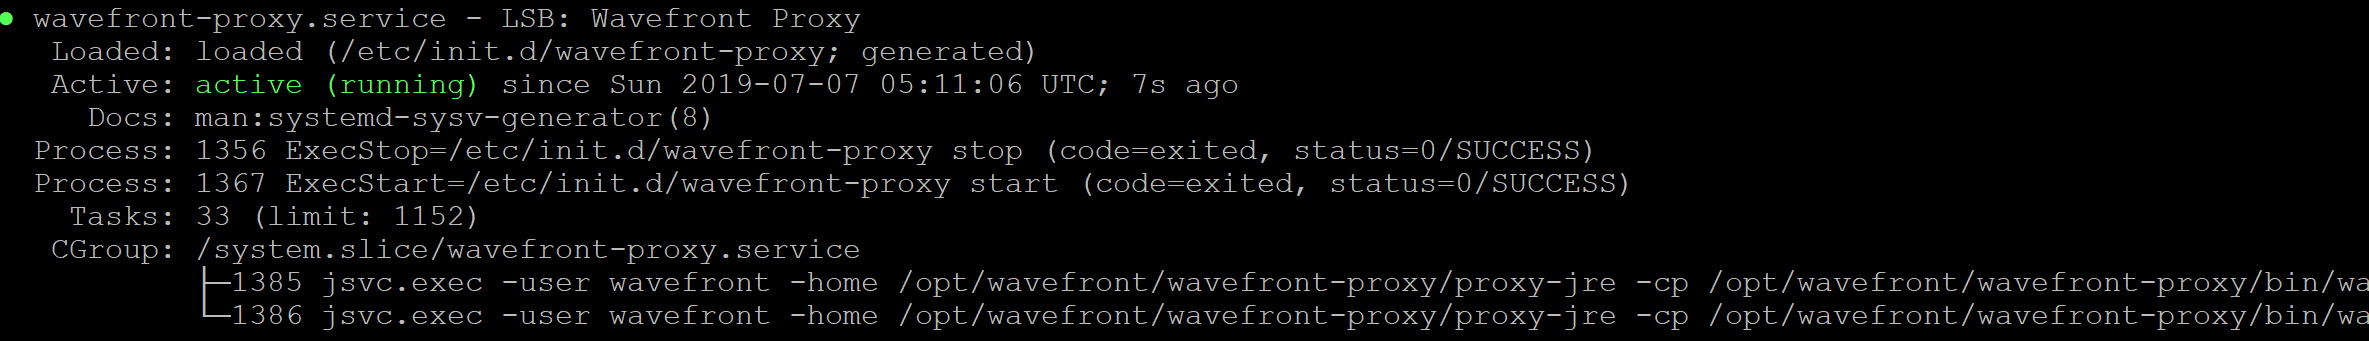
Since we just changed a configuration file, it’s best to go ahead and restart the wavefront-proxy service to ensure the configuration takes effect. Run the following command:
sudo service wavefront-proxy restart
If you so desire, run sudo service wavefront-proxy status to check the service status. You will see from the screenshot shown here that the service was just started again.
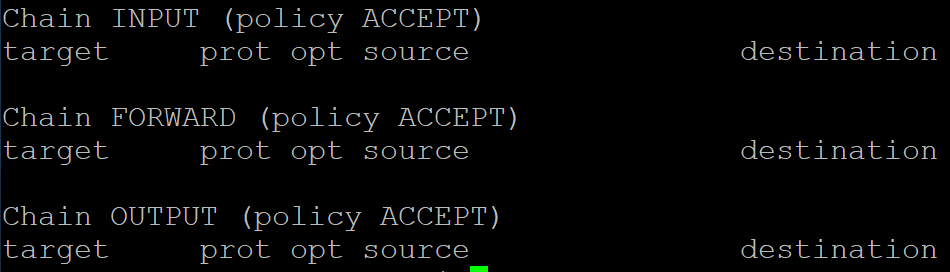
To be thorough, check iptables on the Ubuntu server to ensure port 5055 is open in the operating system firewall. In this case, it is confirmed open.
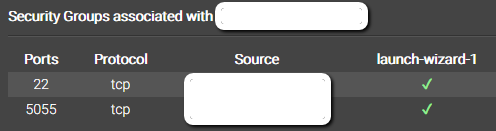
Don’t Forget Cloud Provider Security Measures
We specified port 5055 as the port for log ingestion on our proxy, but TCP traffic on port 5055 has to be able to get to the Ubuntu operating system from the Raspberry Pi at my house. Since the Ubuntu machine is running in AWS EC2, there’s an additional layer to consider. When I first created this VM, the default security group only had a single inbound rule allowing SSH traffic from my home network (nothing else allowed inbound). I needed to add another inbound rule to that same security group to allow TCP traffic on port 5055 to reach the VM. This should mean we have a clear path from the Raspberry Pi to AWS to the Ubuntu VM for log transmission from my home network only.
That’s three different places we had to either check or make a configuration change to ensure port 5055 was open for inbound TCP traffic – at the cloud provider level (AWS security groups), at the operating system firewall level (checking iptables within Ubuntu), and within the proxy configuration file (ensuring the rawLogsPort was set accordingly within wavefront.conf).
Digging into the syslog-ng Configuration…and Baby Steps
At this point we have the proper logs identified to send to our Wavefront proxy and have ensured the proxy can accept them (or so we think). Now it’s back to the Raspberry Pi for some syslog-ng tweaking. The configuration file for syslog-ng is stored inside /etc/syslog-ng/syslog-ng.conf. Before making changes to the configuration file, I used WinSCP to download a copy of the default configuration. This is not a required step, but it makes for a nice rollback point if you accidentally hose the configuration.
Stepping into this slowly, we know one of the log files to send from the Raspberry Pi is /var/log/pihole.log, so I’ll start by showing how to configure syslog-ng to send only this log file and build on it later. Keep in mind the following three blocks of code can be placed together or separated within the syslog-ng.conf file. The source and destination blocks are basically variable declarations (declaring and and setting the values of s_pihole_log and d_wavefront_proxy as source and destination variables respectively). It is the log statement below that sends data.
#Define the object s_pihole_log as a source.

#Use the file() source driver to open and read messages from /var/log/pihole.log.

source s_pihole_log { file("/var/log/pihole.log"); };
#Define the object d_wavefront_proxy as a log destination.

#Use the tcp destination driver to send logs to our Wavefront proxy over TCP port 5055.

#We're using X.X.X.X as the ip address of the Wavefront proxy.

destination d_wavefront_proxy {tcp("X.X.X.X" port(5055)); };
#Send logs from the source object s_pihole_log to the destination object d_wavefront_proxy.

log { source(s_pihole_log); destination(d_wavefront_proxy); };
Once these lines have been added to syslog-ng.conf, save the configuration file. Then, go ahead and restart syslog-ng: sudo service syslog-ng restart
If all steps were performed correctly, syslog-ng should be reading from pihole.log and sending the data to our Wavefront proxy.
But How Do I Know My Logs Made It to the Proxy?
It appears we have the pathways clear and logs shipping to the proxy via TCP 5055, but there has to be something on the proxy side that confirms log data is being received, right? Keep in mind at this point we have not specified any metrics to collect from the logs. All we have done is tell syslog-ng what to send, where to send it, and asked it to execute. Stay tuned for the next post in this series where we will dive into verifying the logs made it to the proxy successfully.
Further Reading
This blog is part 2 in a series on analyzing Pi-hole log data with Wavefront. Check out the other posts in the series:
- Part 1 – Creating a Wavefront Proxy in AWS
- Part 2 – This post
- Part 3 – Verifying Wavefront Proxy Log Ingestion
- Part 4 – Fishing for Wavefront Metrics with Grok Patterns
- Part 5 – Pi in the Sky: Using Wavefront to Analyze Pi-Hole Data
- Part 6 – Coming soon!
So I don’t use a Raspberry Pi, and my Pi Hole is on free tier of Google’s cloud hosting (split cast VPN). Assuming Wavelength doesn’t use up too much system resources to bump me out of free tier, couldn’t I theoretically install wavelength alongside my pihole?
https://github.com/rajannpatel/Pi-Hole-PiVPN-on-Google-Compute-Engine-Free-Tier-with-Full-Tunnel-and-Split-Tunnel-OpenVPN-Configs/blob/master/README.md
Wavefont itself is a cloud service. The VM I have in Amazon EC2 runs Ubuntu and is a Wavefont proxy (just serves as a shipper of data to the Wavefront service). So in order to do something similar, you would need to do a trial. To answer your question directly, you could potentially run a Wavefront proxy in GCP as long as your operating system meets the system requirements. I hope that helps.