In my last post in this series, it looks like we have everything in place for the Wavefront proxy to receive Pi-hole log data (only sending data from pihole.log for now), but how can we confirmed the logs were received by the proxy before working to create metrics from the log contents? This particular part stumped me big time as I was going through it. I thought it might be helpful to share attempted dead ends to show the thought process.
A Simple Metric Test
This document shows a way to test if a Wavefront proxy is sending and receiving data, but the test only helps if you’re ingesting metric data in the Wavefront Data Format via port 2878. In our case metrics will come from logs sent to the proxy, and the proxy will ingest log data specifically via TCP port 5055. There’s a first dead end.
Diving into Logs
I had already referenced this document to get the path to wavefront.conf, but it also specifies where the proxy logs are stored for Ubuntu: /var/log/wavefront/wavefront.log Why not check to see if there is some indication of log data being received in this log? Since all paths from the Raspberry Pi to the proxy should be open, start watching the live log by logging into the proxy via SSH and running the following command:
tail -f /var/log/wavefront/wavefront.log
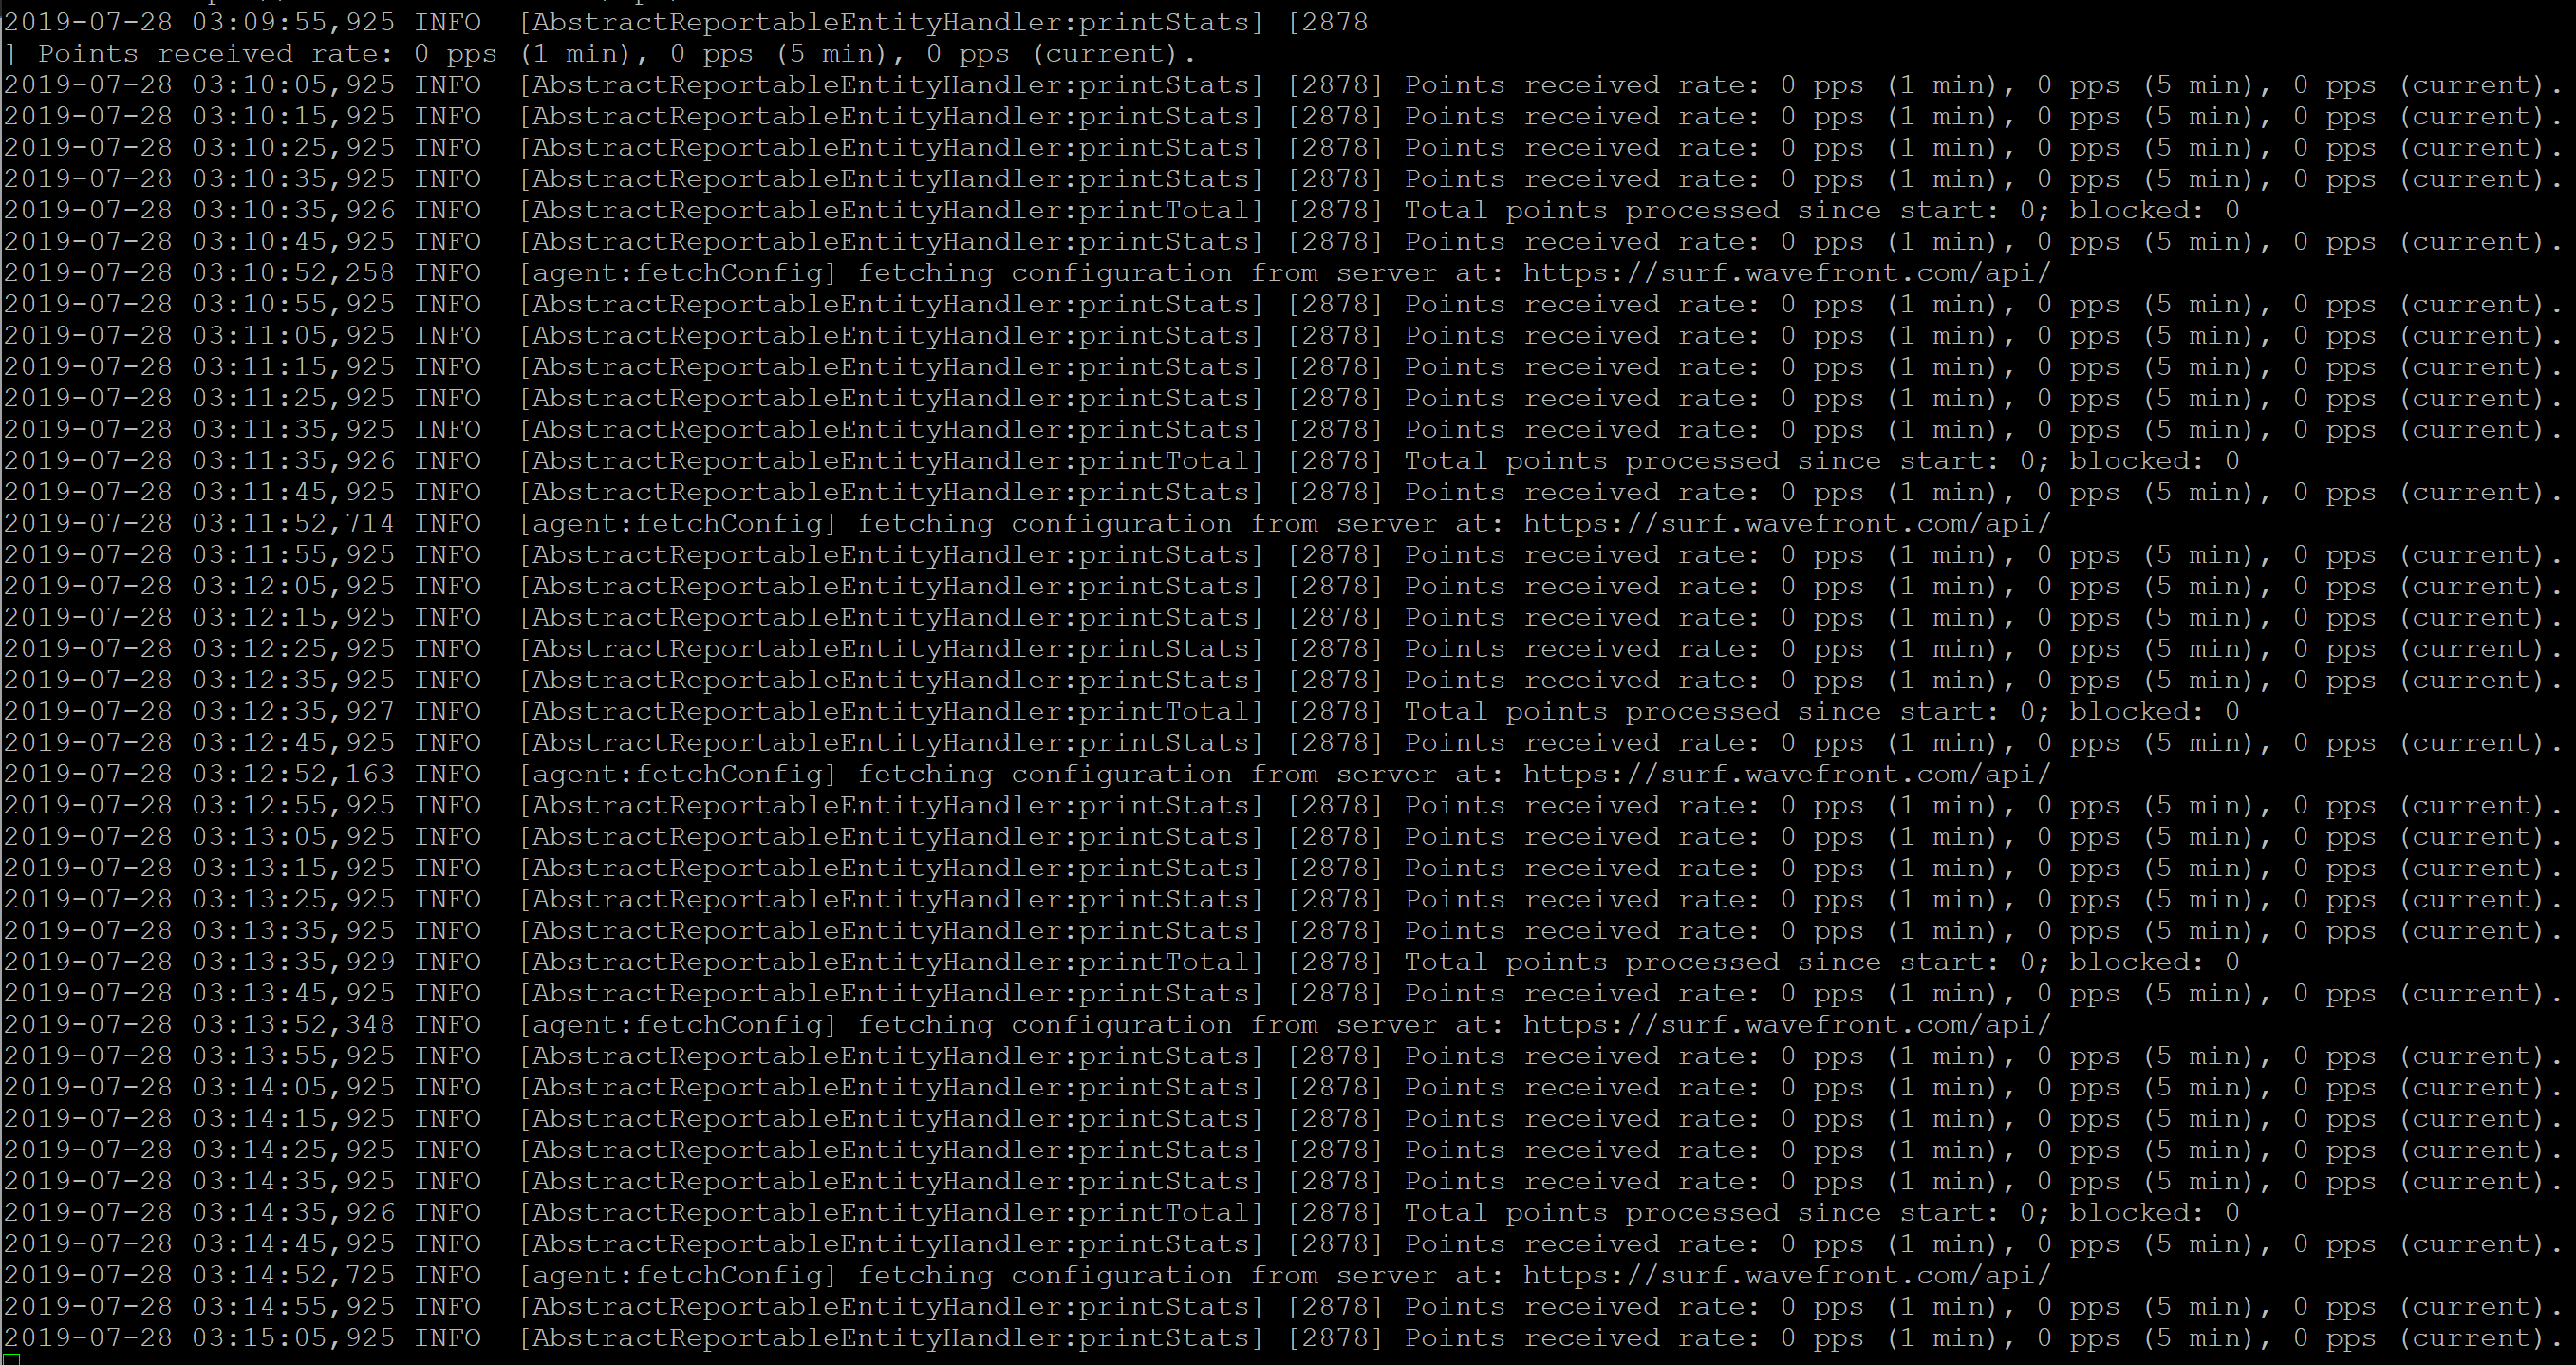
As you can see, most everything here references port 2878 (which we are not using for metric ingestion). That’s not extremely helpful, unfortunately.
I thought at this point it might require more detailed logging. In the document referenced above on configuring proxies, there is a pushLogLevel parameter inside wavefront.conf that is set to SUMMARY by default. Would setting that parameter to DETAILED show anything different in the log (more info in this document)? I decided to try it. Run the following command to edit wavefront.conf:
sudo vi /etc/wavefront/wavefront-proxy/wavefront.conf
Change the pushLogLevel parameter to DETAILED (picture of this line shown below as well), save your changes, and exit wavefront.conf.
pushLogLevel=DETAILED

Then, restart the wavefront-proxy service:
sudo service wavefront-proxy restart
If we go back and tail wavefront.log again, the output looks like this:
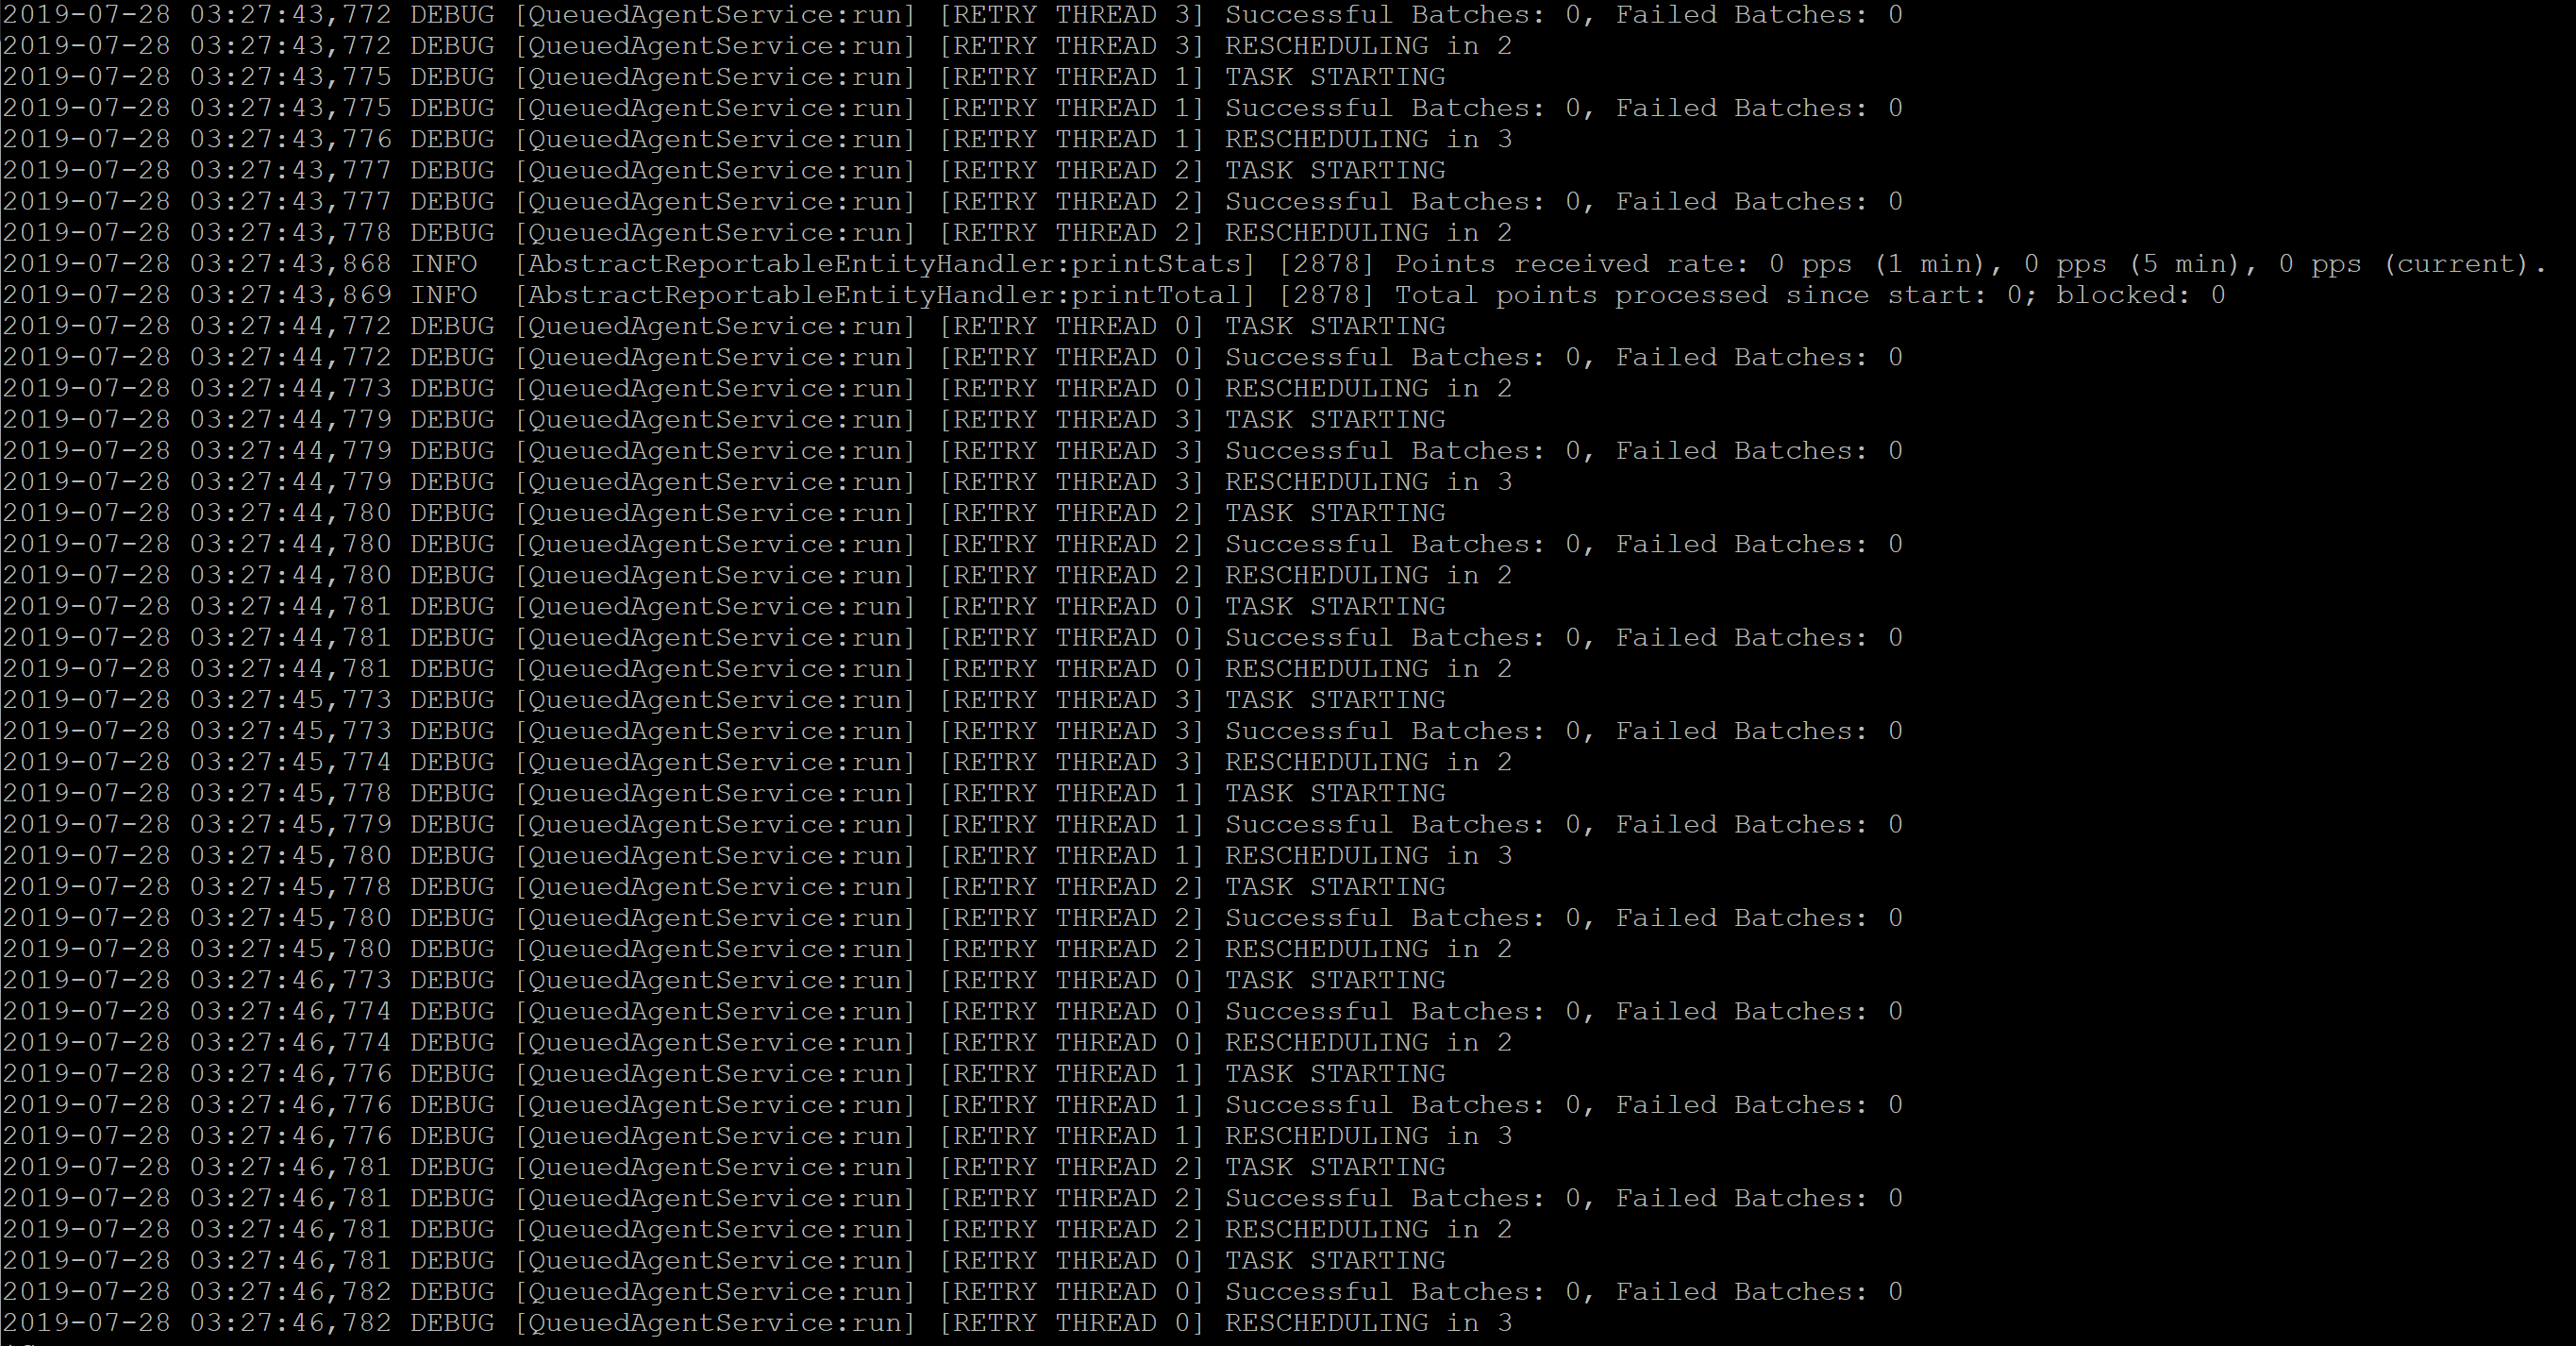
Now there are DEBUG messages in addition to the INFO messages we saw previously. But again, there’s nothing here about whether our logs made it to the proxy (even after tailing the log for a few minutes). That’s a second dead end. At this point, one might think we should set the pushLogLevel parameter back to SUMMARY, but I left it at DETAILED just in case.
Fixing a Misconfiguration
Remember the two lines we added to wavefront.conf in part 2 of this blog series? In making those changes, we referenced a config file that did not yet exist. I later found (through a little luck and some tinkering) that the absence of this file throws some errors when the wavefront-proxy service gets restarted, and those effects cascade. But if you aren’t tailing the logs, you might miss it completely. Rather than run into problems later, we can avoid them by addressing this now. First, here’s what the wavefront.log shows upon restart of the wavefront-proxy service.
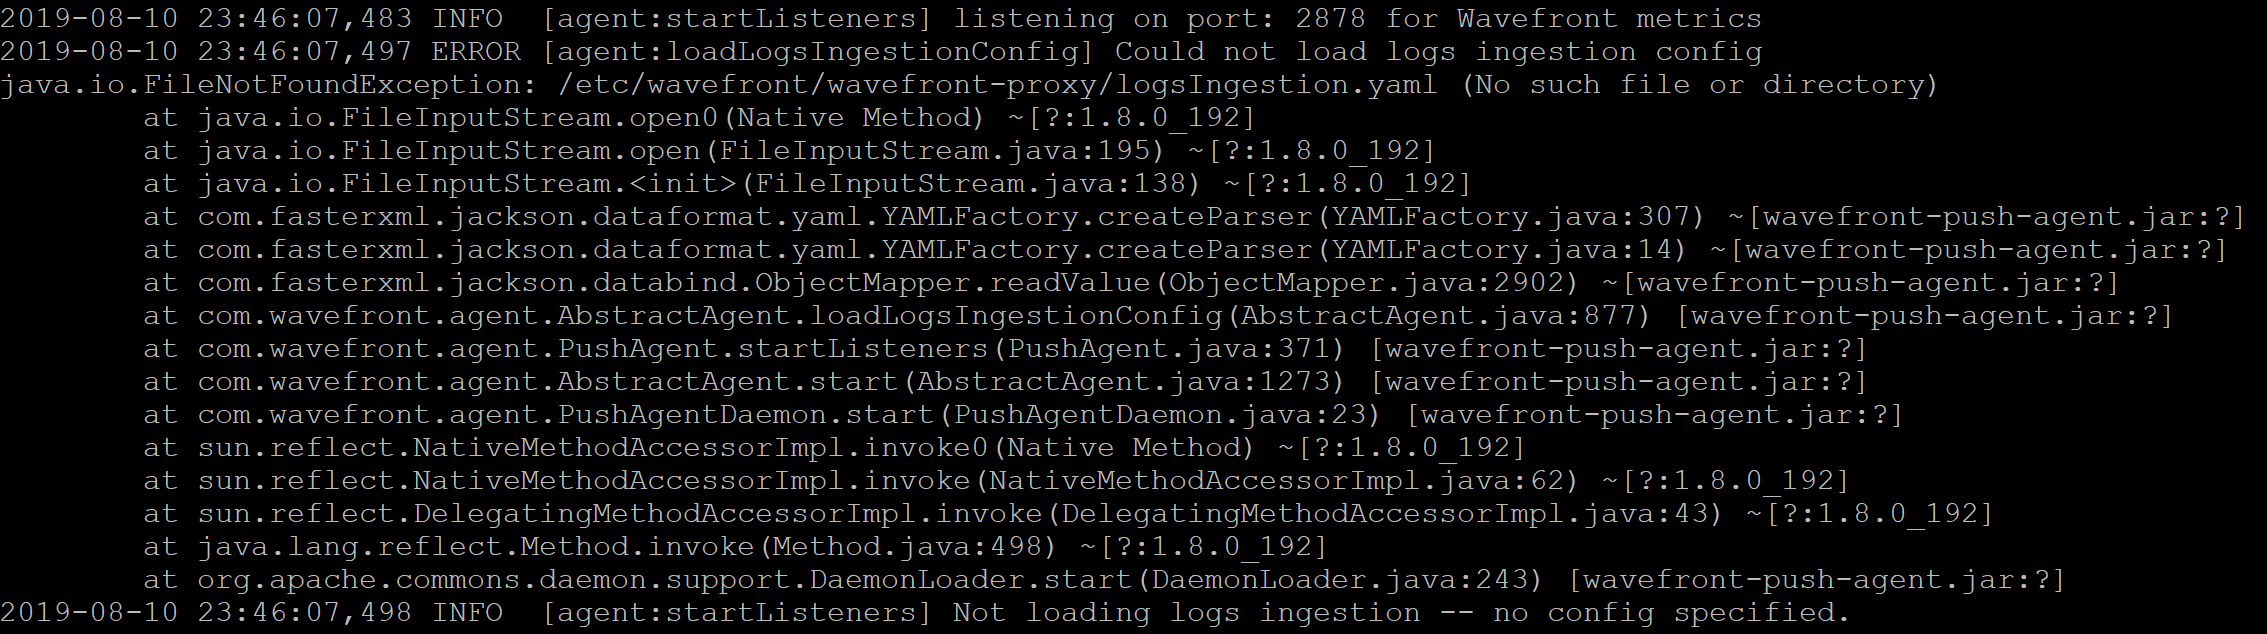
Notice the specific line in the log is labeled with ERROR instead of INFO or DEBUG and alerts us to the fact that the config file does not exist. At this point you may wonder the same thing I did…will just creating the file /etc/wavefront/wavefront-proxy/logsIngestion.yaml clear the error, even if it has no content? We have not really discussed what goes in the yaml file to this point. If we create an empty logsIngestion.yaml file and restart the wavefront-proxy service, the scenery changes a little.
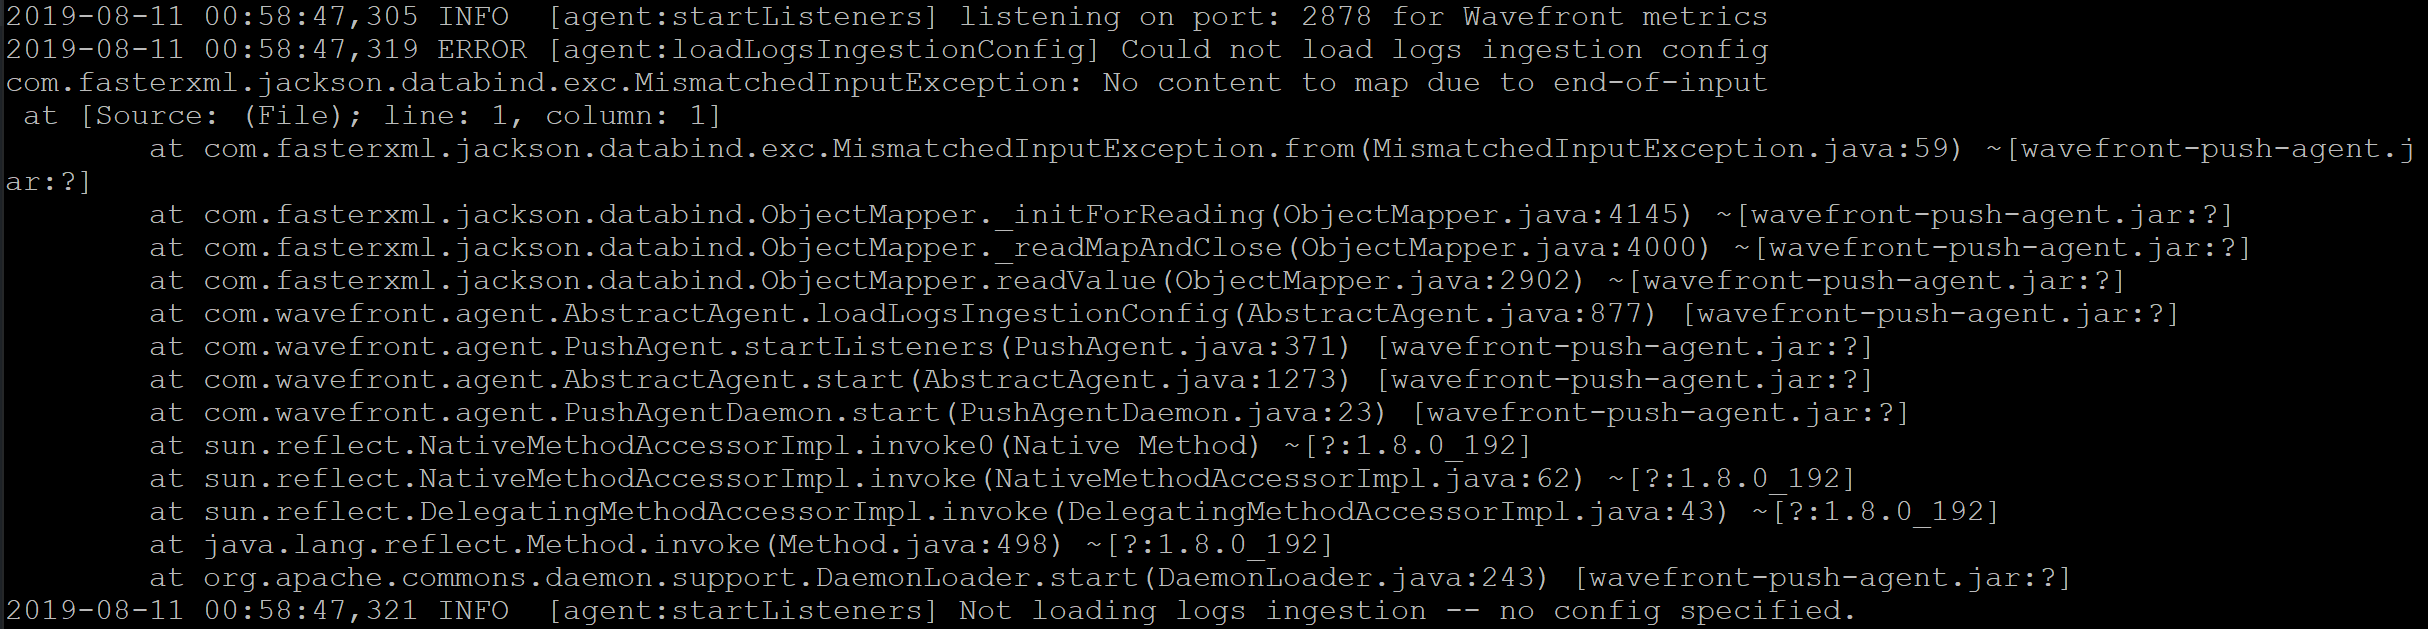
While we did clear the original error about the file not existing, there are now errors about the file being empty. How do we get past this if we don’t understand what goes in this yaml file? I tried adding a single line comment to the file (use the character # to comment a line), but the new error did not disappear. Take a look at this example from the Wavefront documentation. What if we add that first line to logsIngestion.yaml?
aggregationIntervalSeconds: 5 # Metrics are aggregated and sent at this interval
Once this has been added to the file, save your changes. Now, keep tailing wavefront.log while restarting the wavefront-proxy service. Here’s how things change:

Notice the proxy is now listening on port 5055 for raw logs (or logs in TCP format). That is something we were not able to previously confirm. While this configuration may have been made a little late in the game for a great how-to article, it’s something I learned the hard way. There is no need to make additional tweaks to logsIngestion.yaml for now.
Out of Logs and into the Wavefront Interface
At this point I figured I had missed something inside the Wavefront interface that would show evidence of the logs reaching the proxy. According to this document, Wavefront collects its own internal metrics, and there’s a special Wavefront Usage Integration which may be helpful. Those documents indicate there are internal metrics collected about proxies, so let’s explore this option.
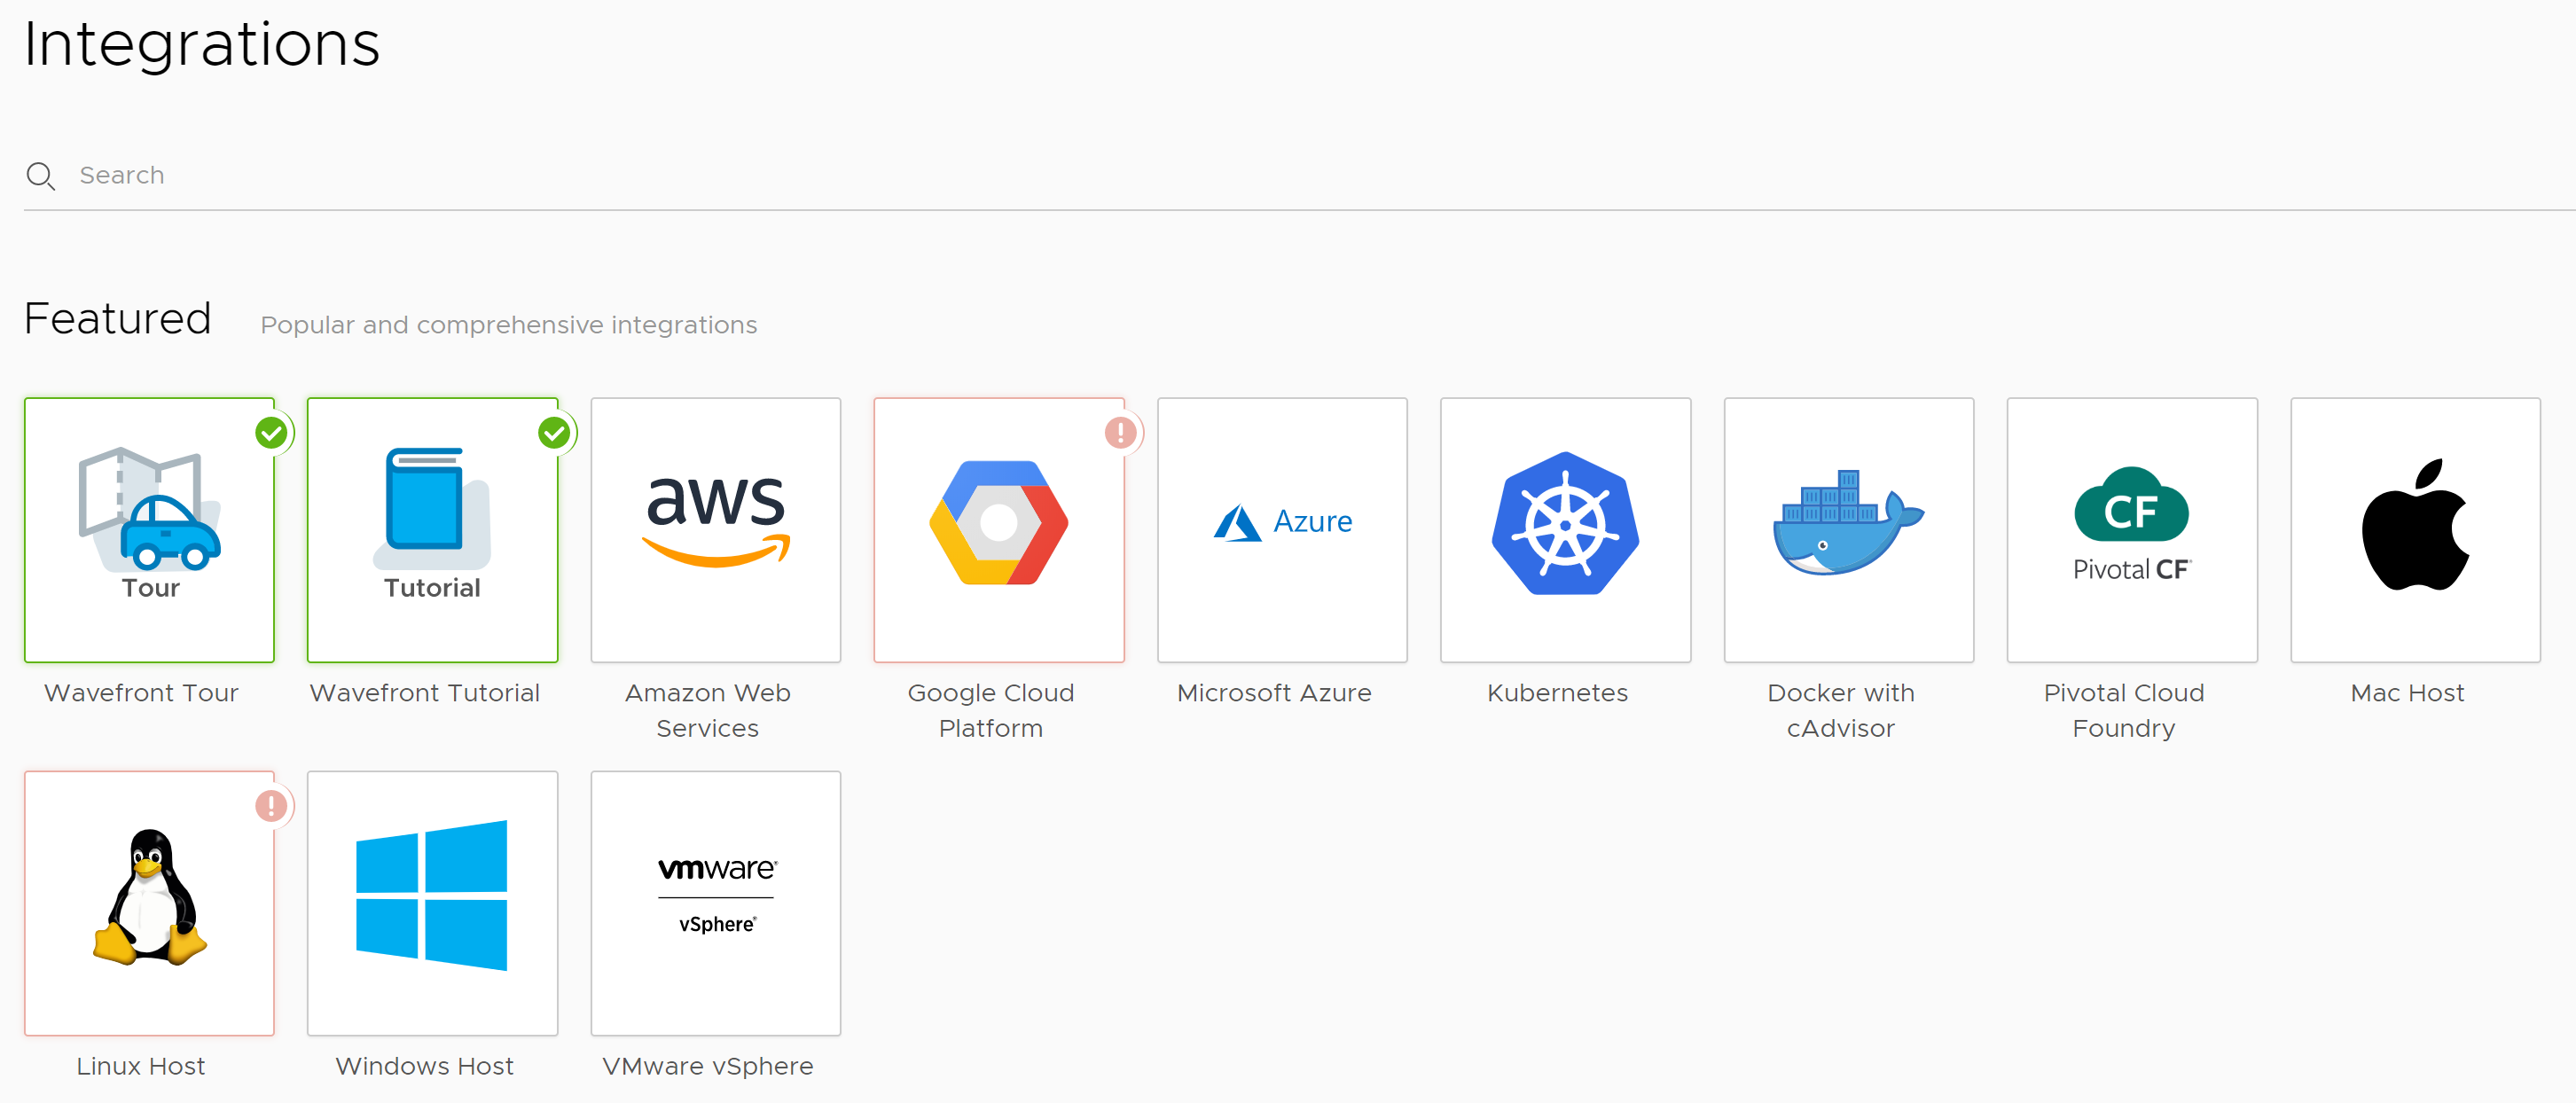
Login to the Wavefront interface, and click Integrations.
![]()
Here we see a number of Featured Integrations (many more further down on this page not shown here), but there’s no Wavefront Usage Integration tile.
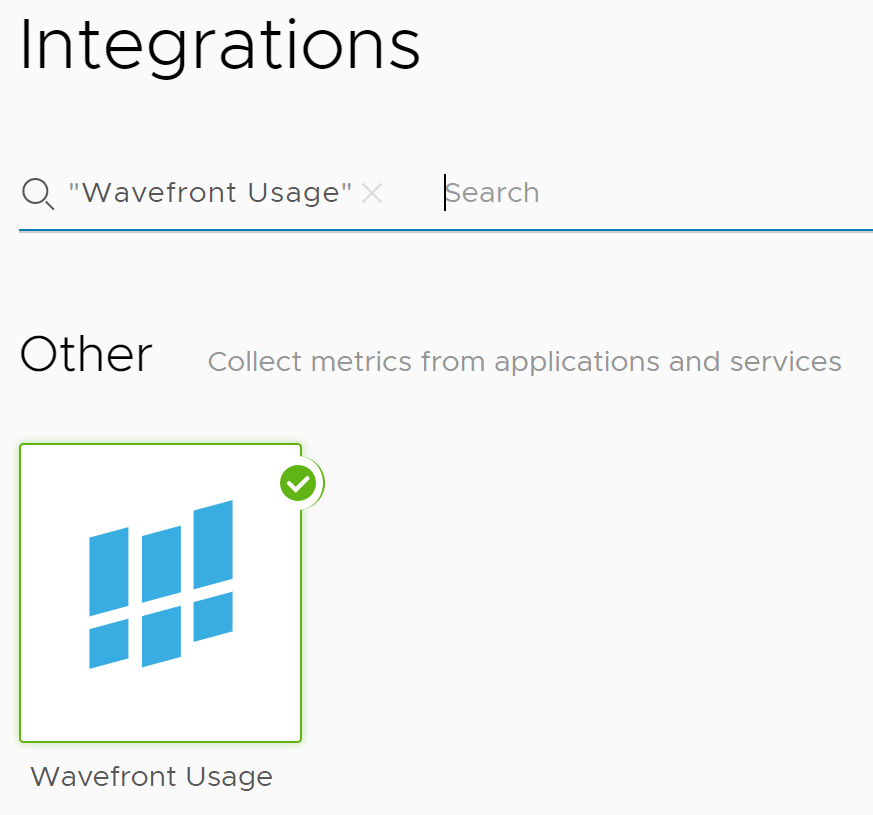
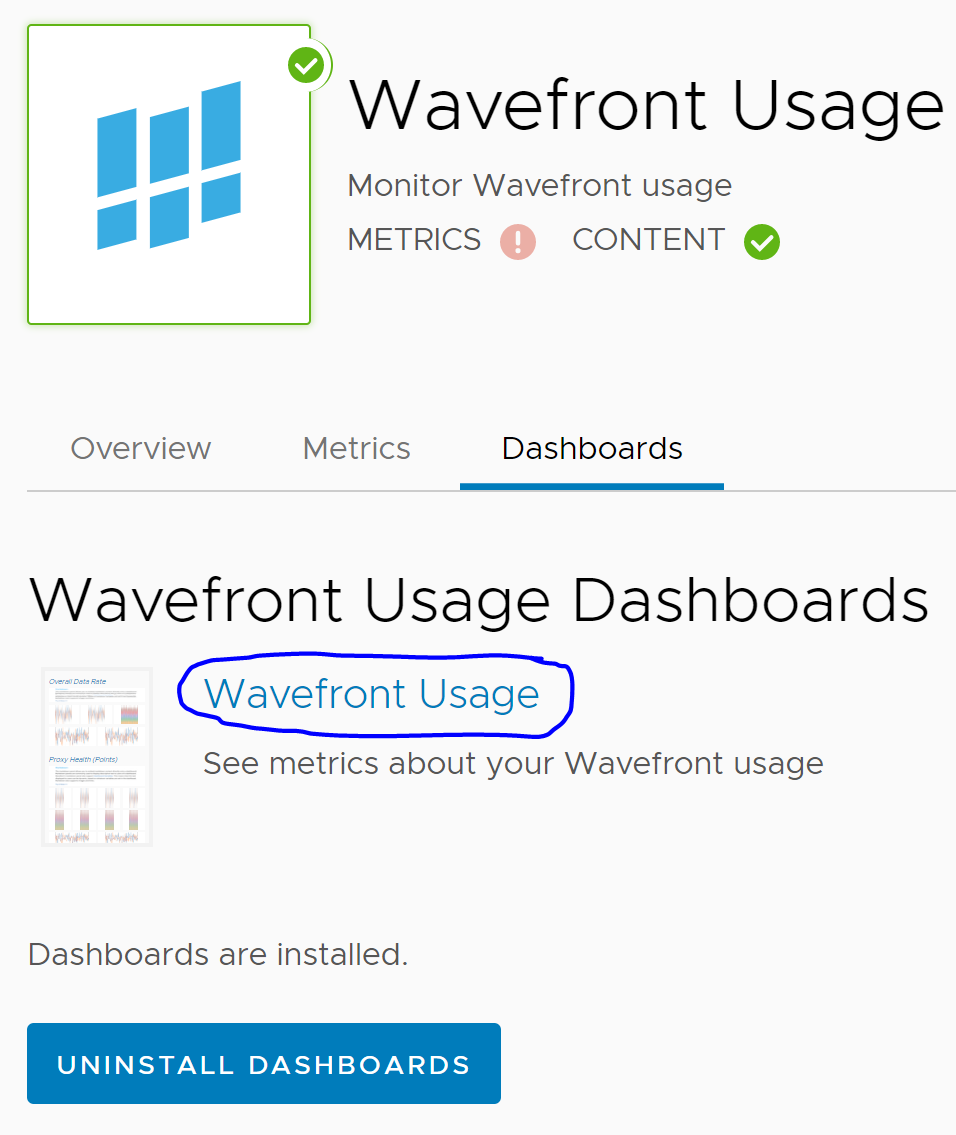
A quick search for Wavefront Usage shows the integration we want. The green check mark means the integration is active. Click on the Wavefront Usage tile to continue.
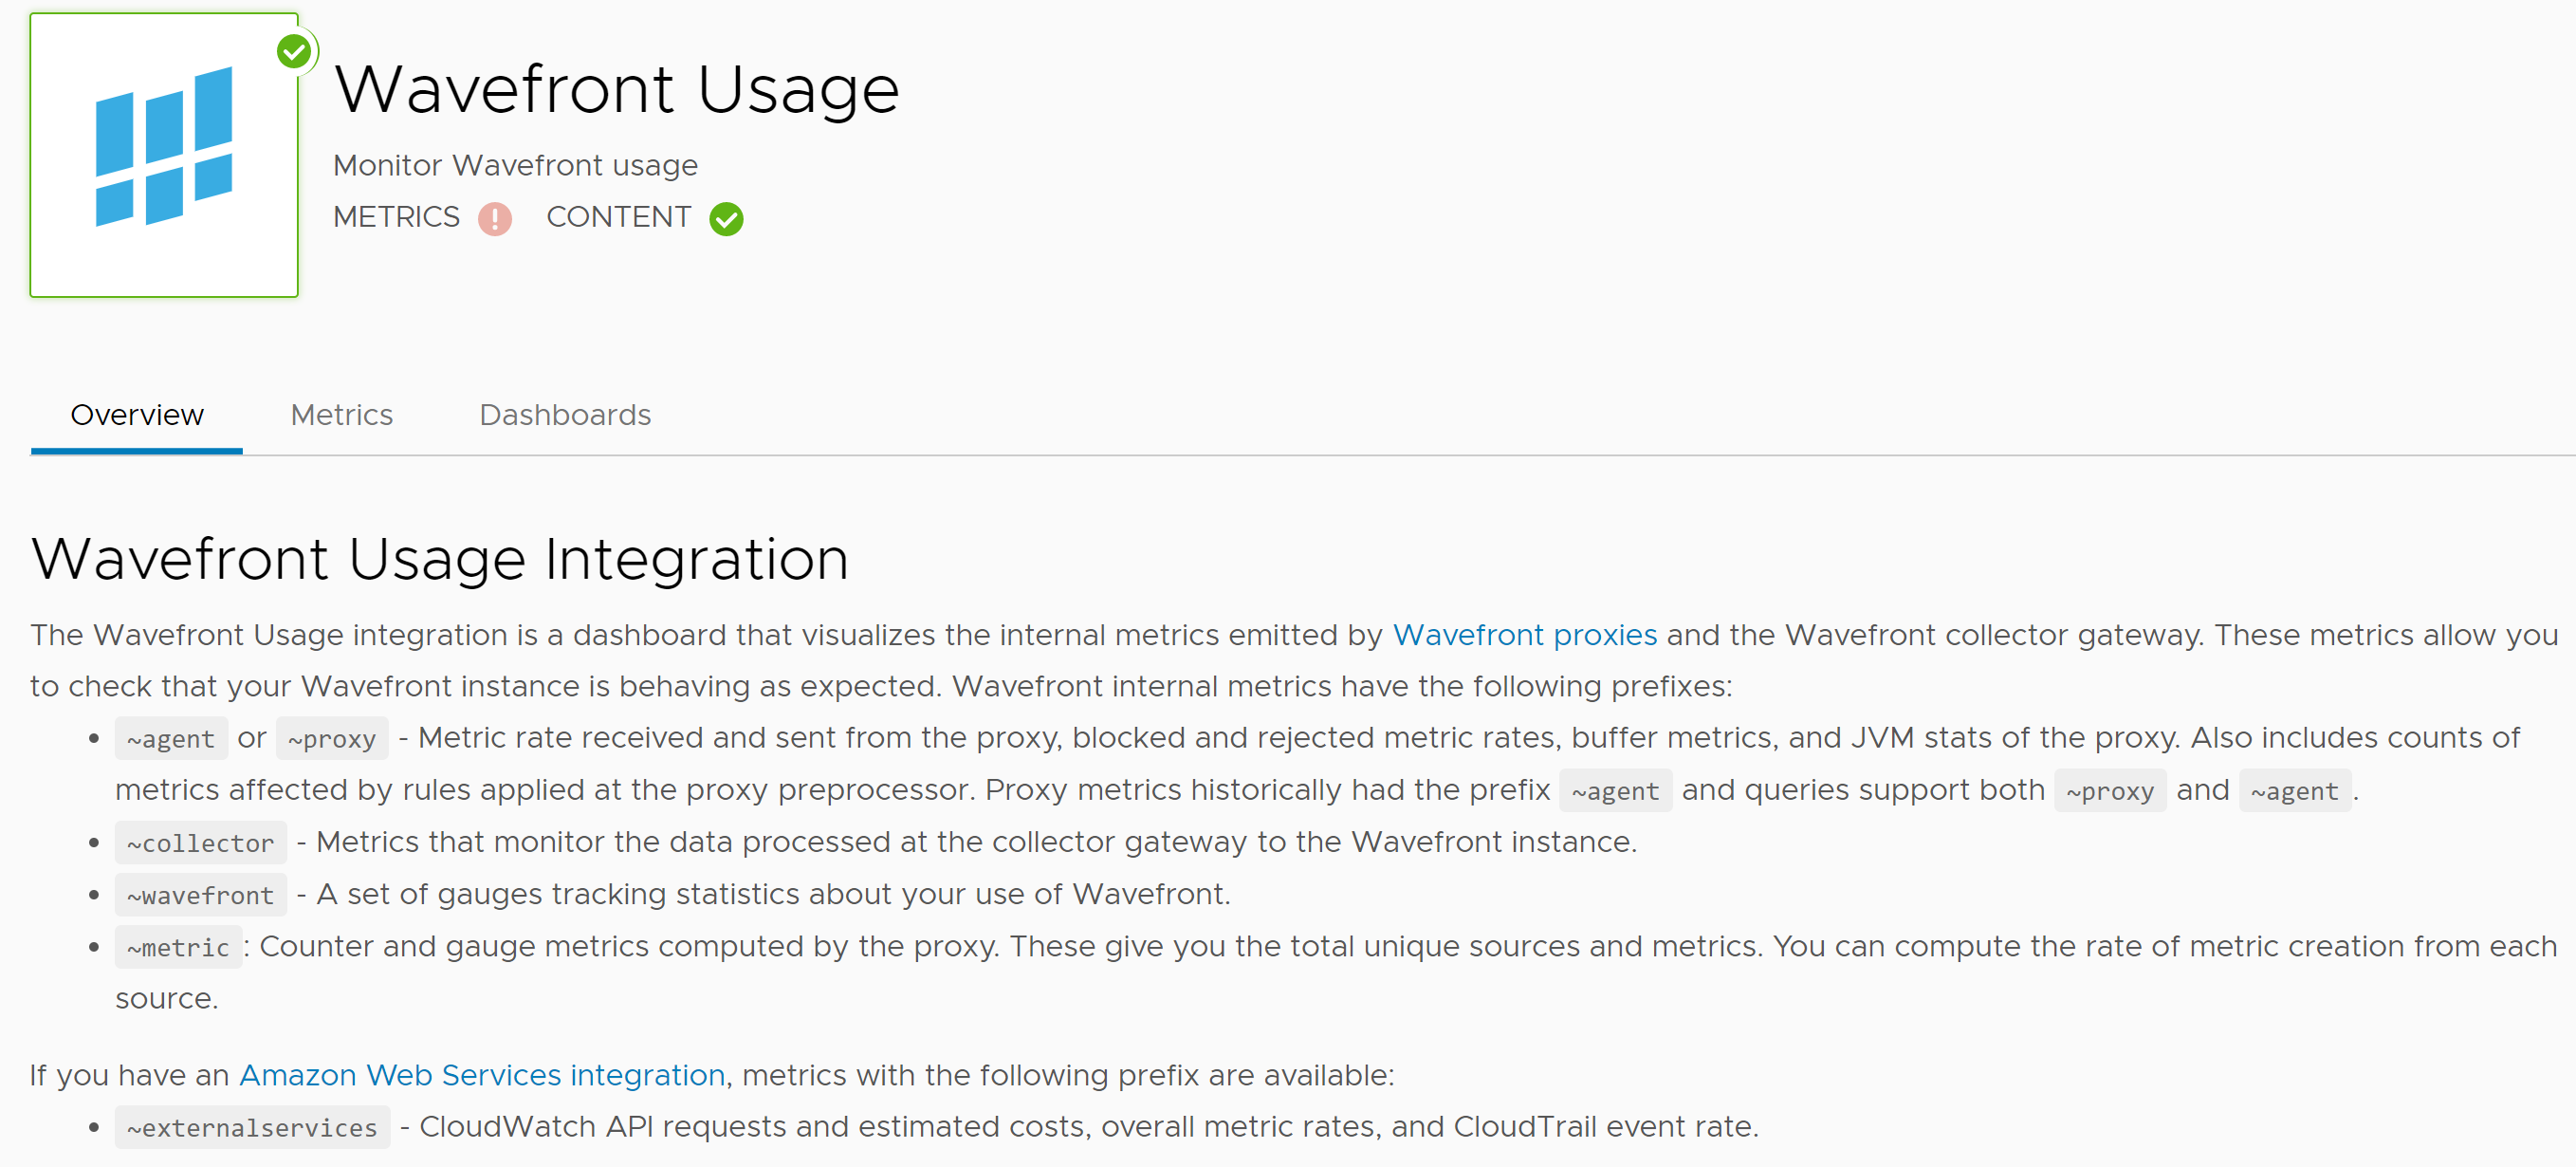
After clicking on that tile, our view changes a bit. Since ~proxy is a type of internal metric, maybe we’re closer to finding the answer to “did the logs make it to our proxy?”
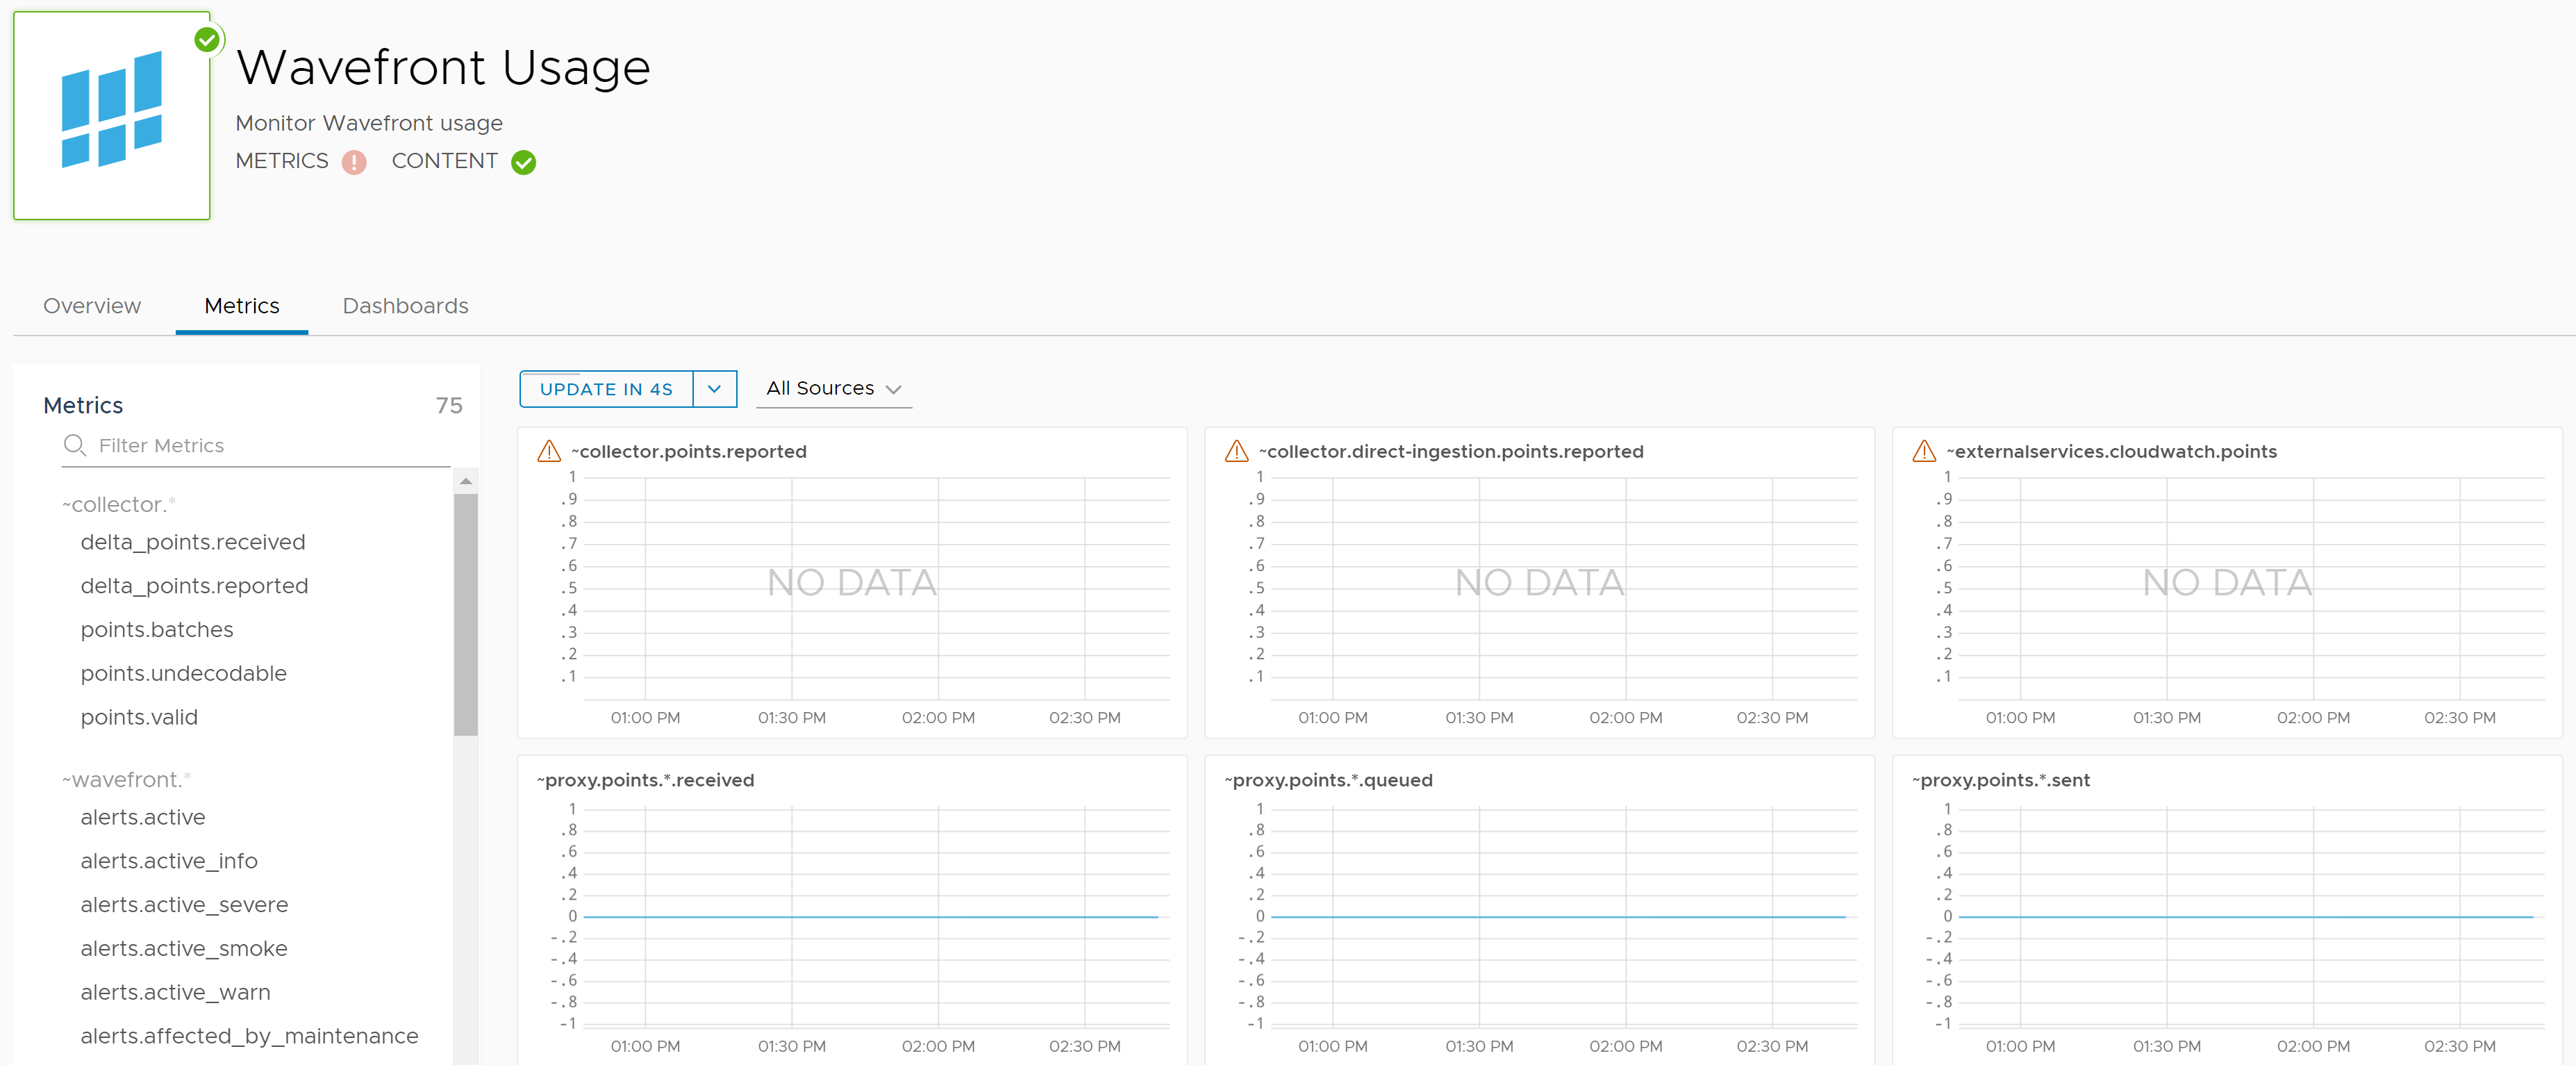
If we click on the Metrics tab, many of the charts are showing no data. Does it make sense why that might be? Any time we see “points” in the screenshot below, that means metrics (as in non-internal metrics that have been sent from the proxy to Wavefront). If you recall from our project thus far, we haven’t pulled any metrics out of the logs we’re sending, so there should be no metrics processed at the collector gateway to our Wavefront instance (i.e. the ~collector internal metric should not show any points received). Doing a search of the metrics list below had nothing labeled ~proxy.
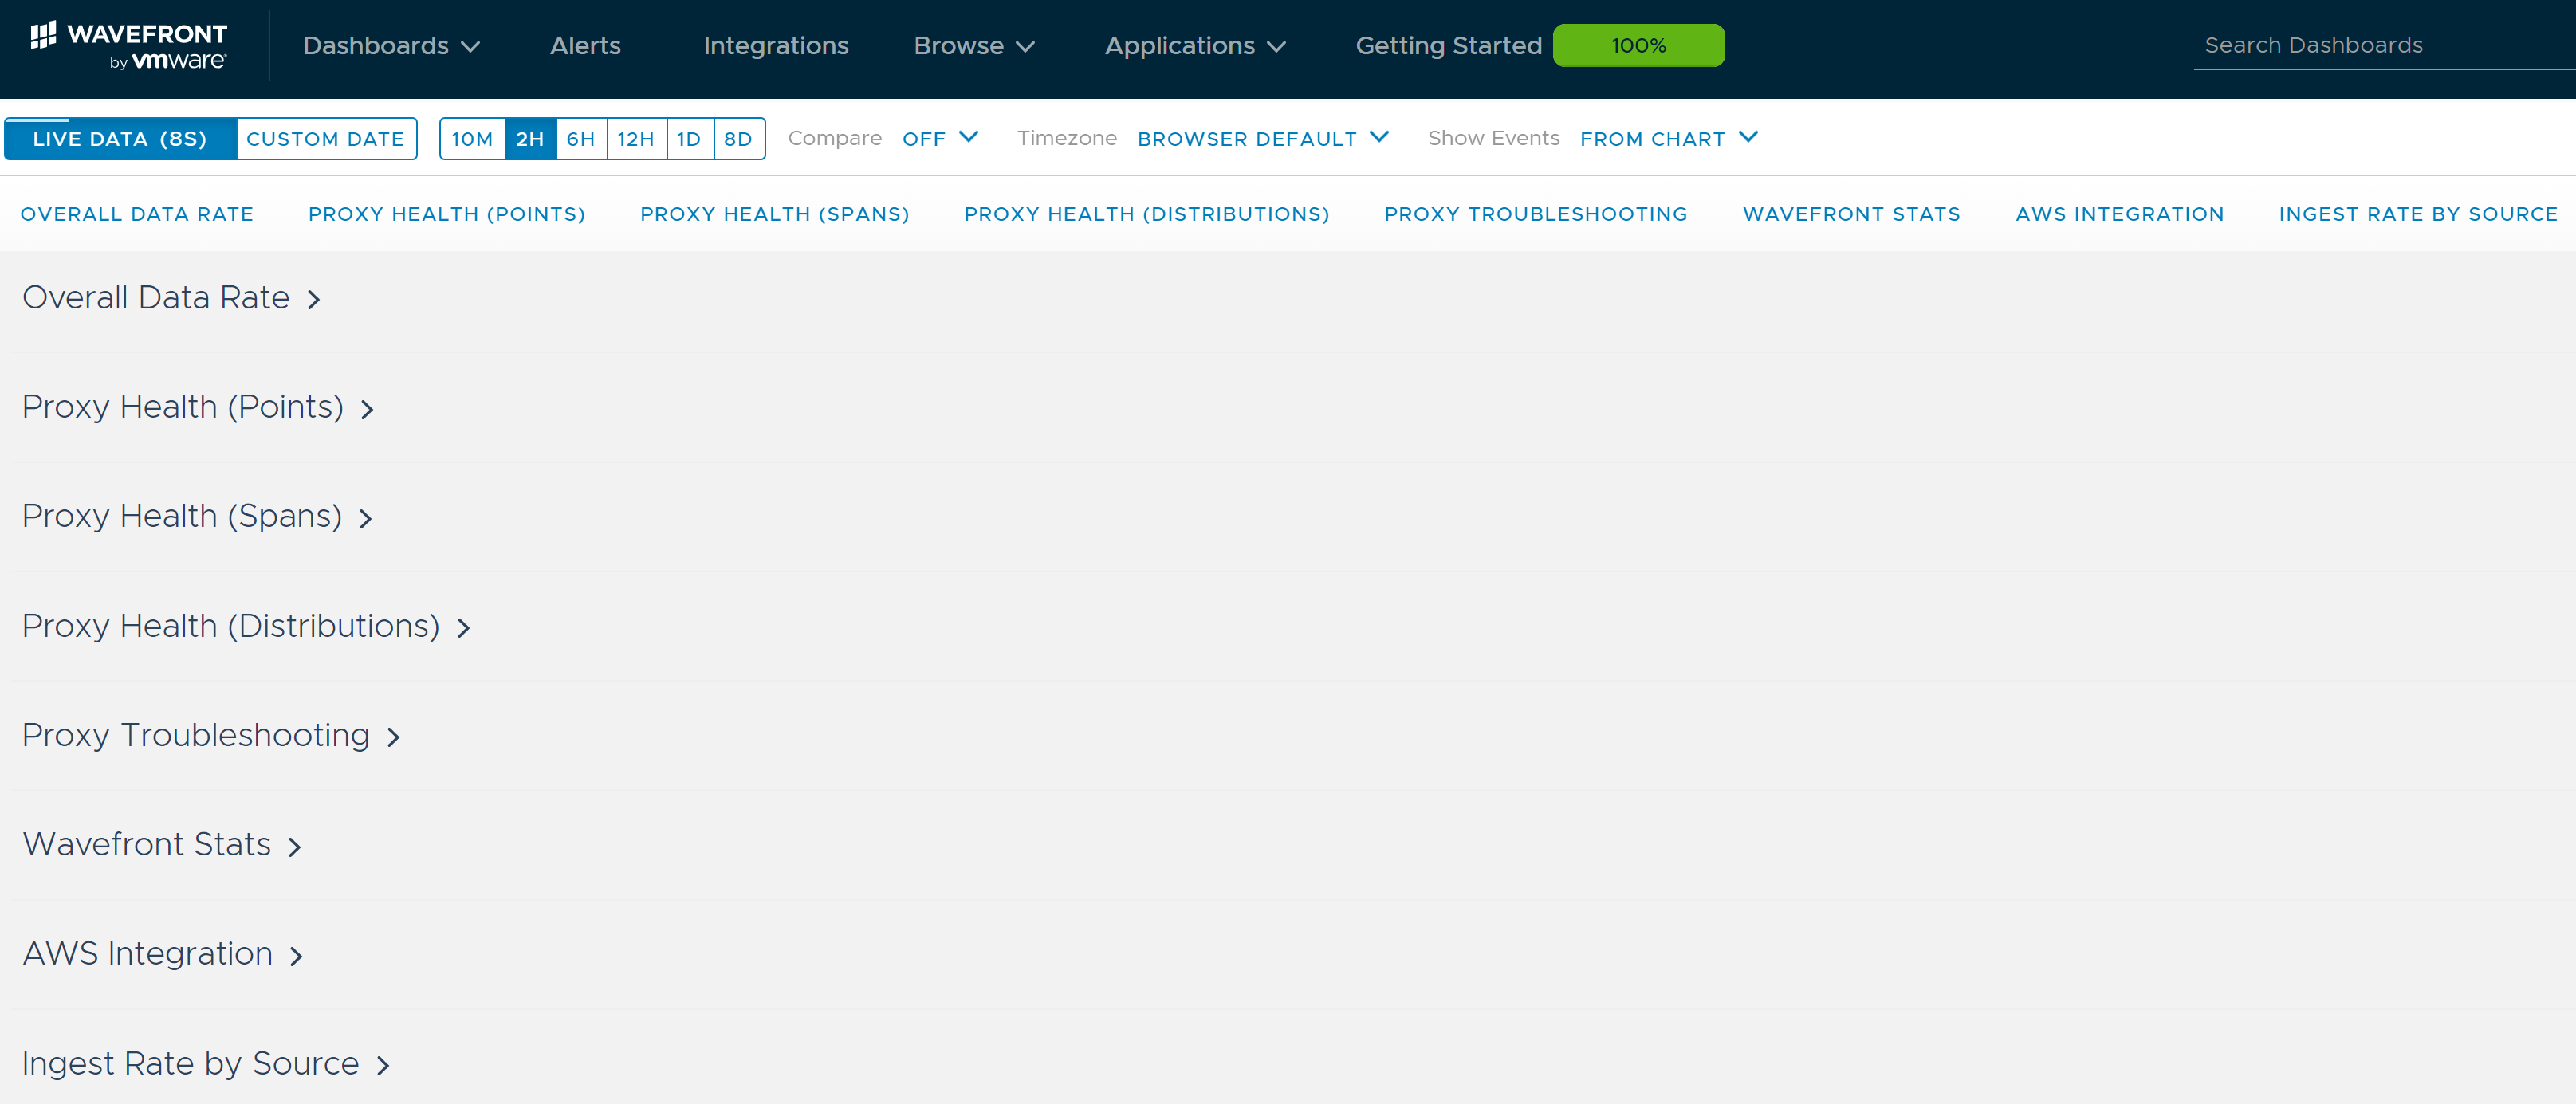
Wait a minute. What about the Dashboards tab? Maybe there’s something useful there. Click on the Wavefront Usage link below to see.
Once you click the link, prepare yourself to receive an absolute treasure trove of information about what’s happening in this Wavefront Instance (all of it updated in near real-time). I’ve collapsed all the different categories of information to make it easier to see what types of information are available.
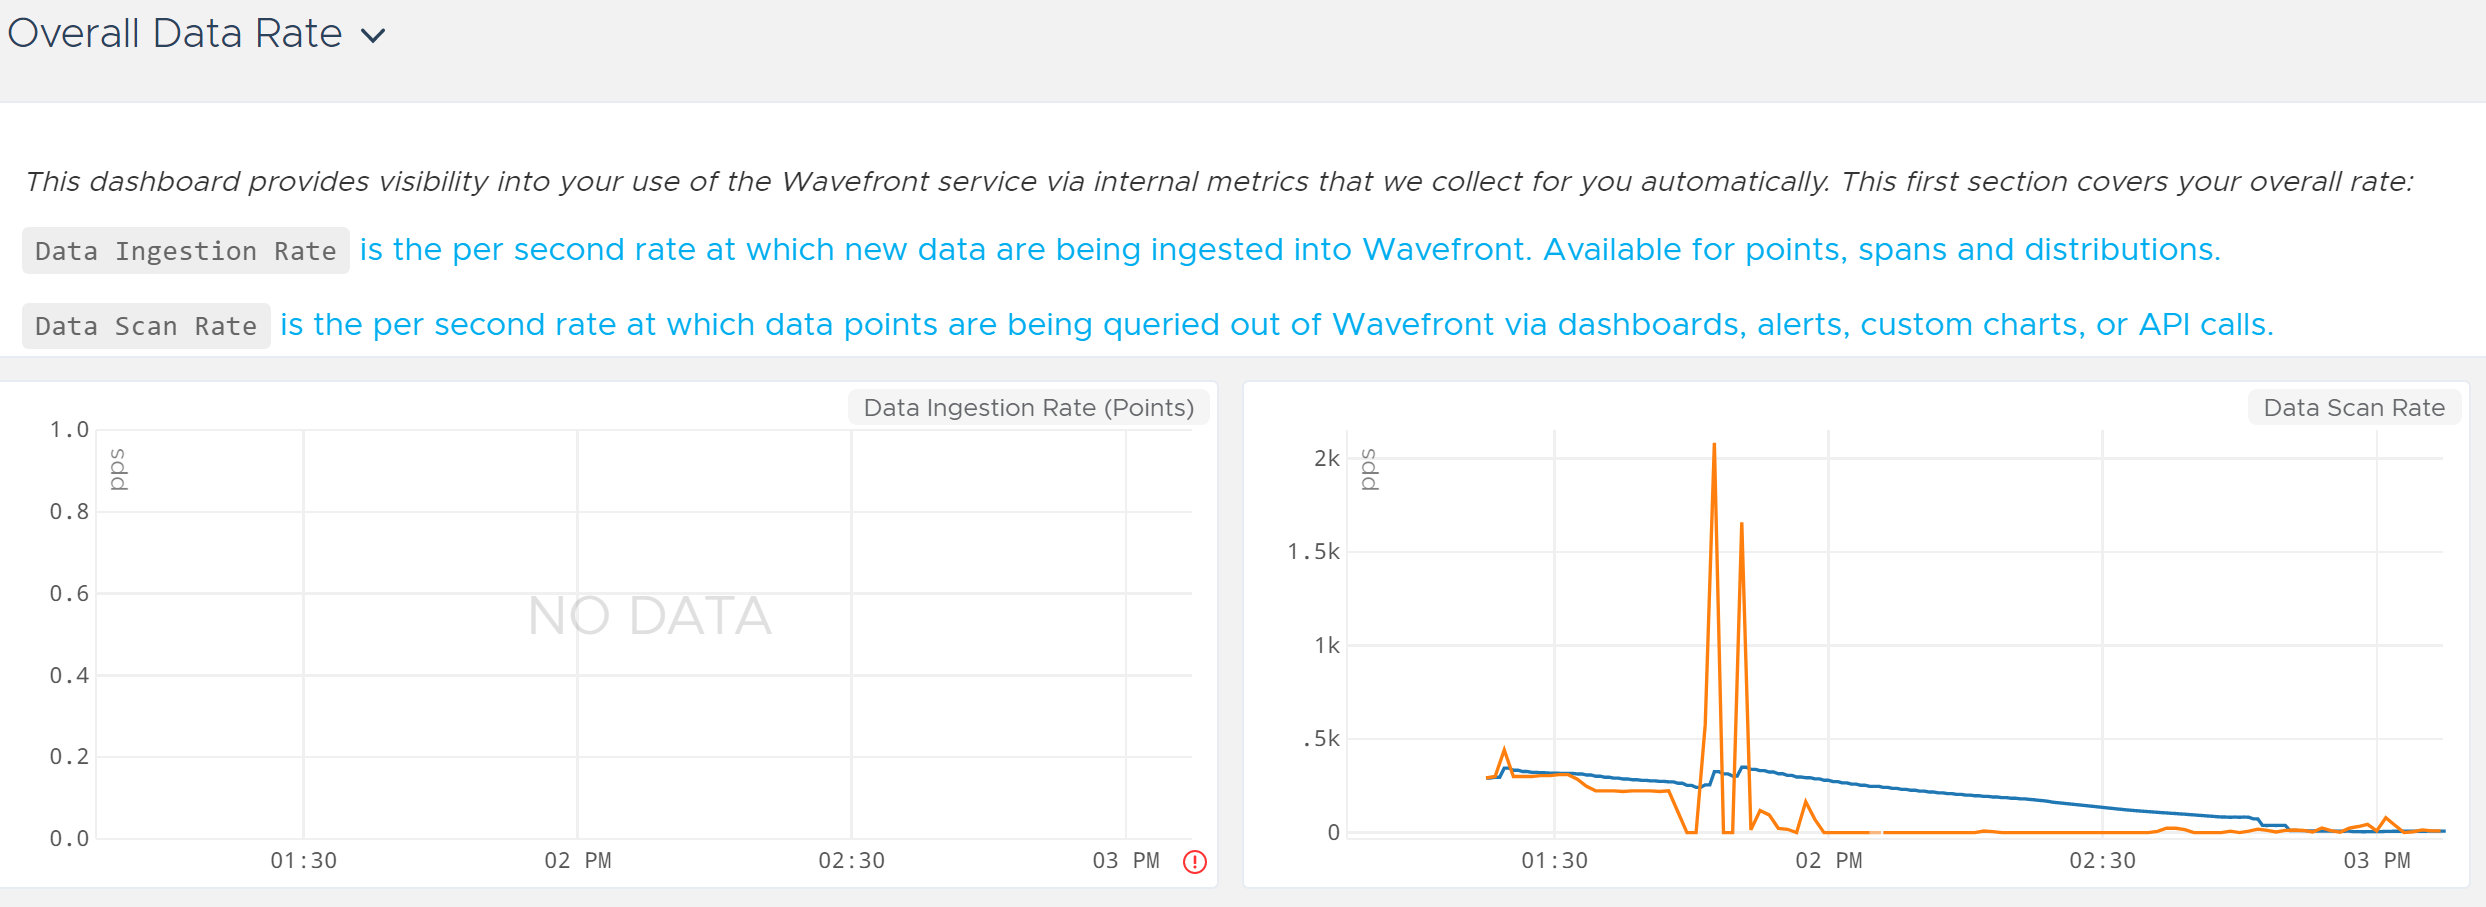
This particular set of dashboards probably merits an entire post in and of itself, but let’s look at the Overall Data Rate portion. Notice the Data Ingestion Rate graph has no data. That should make sense because we aren’t sending metric data (or “points”) to the Wavefront instance yet. We have merely sent logs to the proxy. The Data Scan Rate makes sense because Wavefront is collecting information about the proxy we deployed.
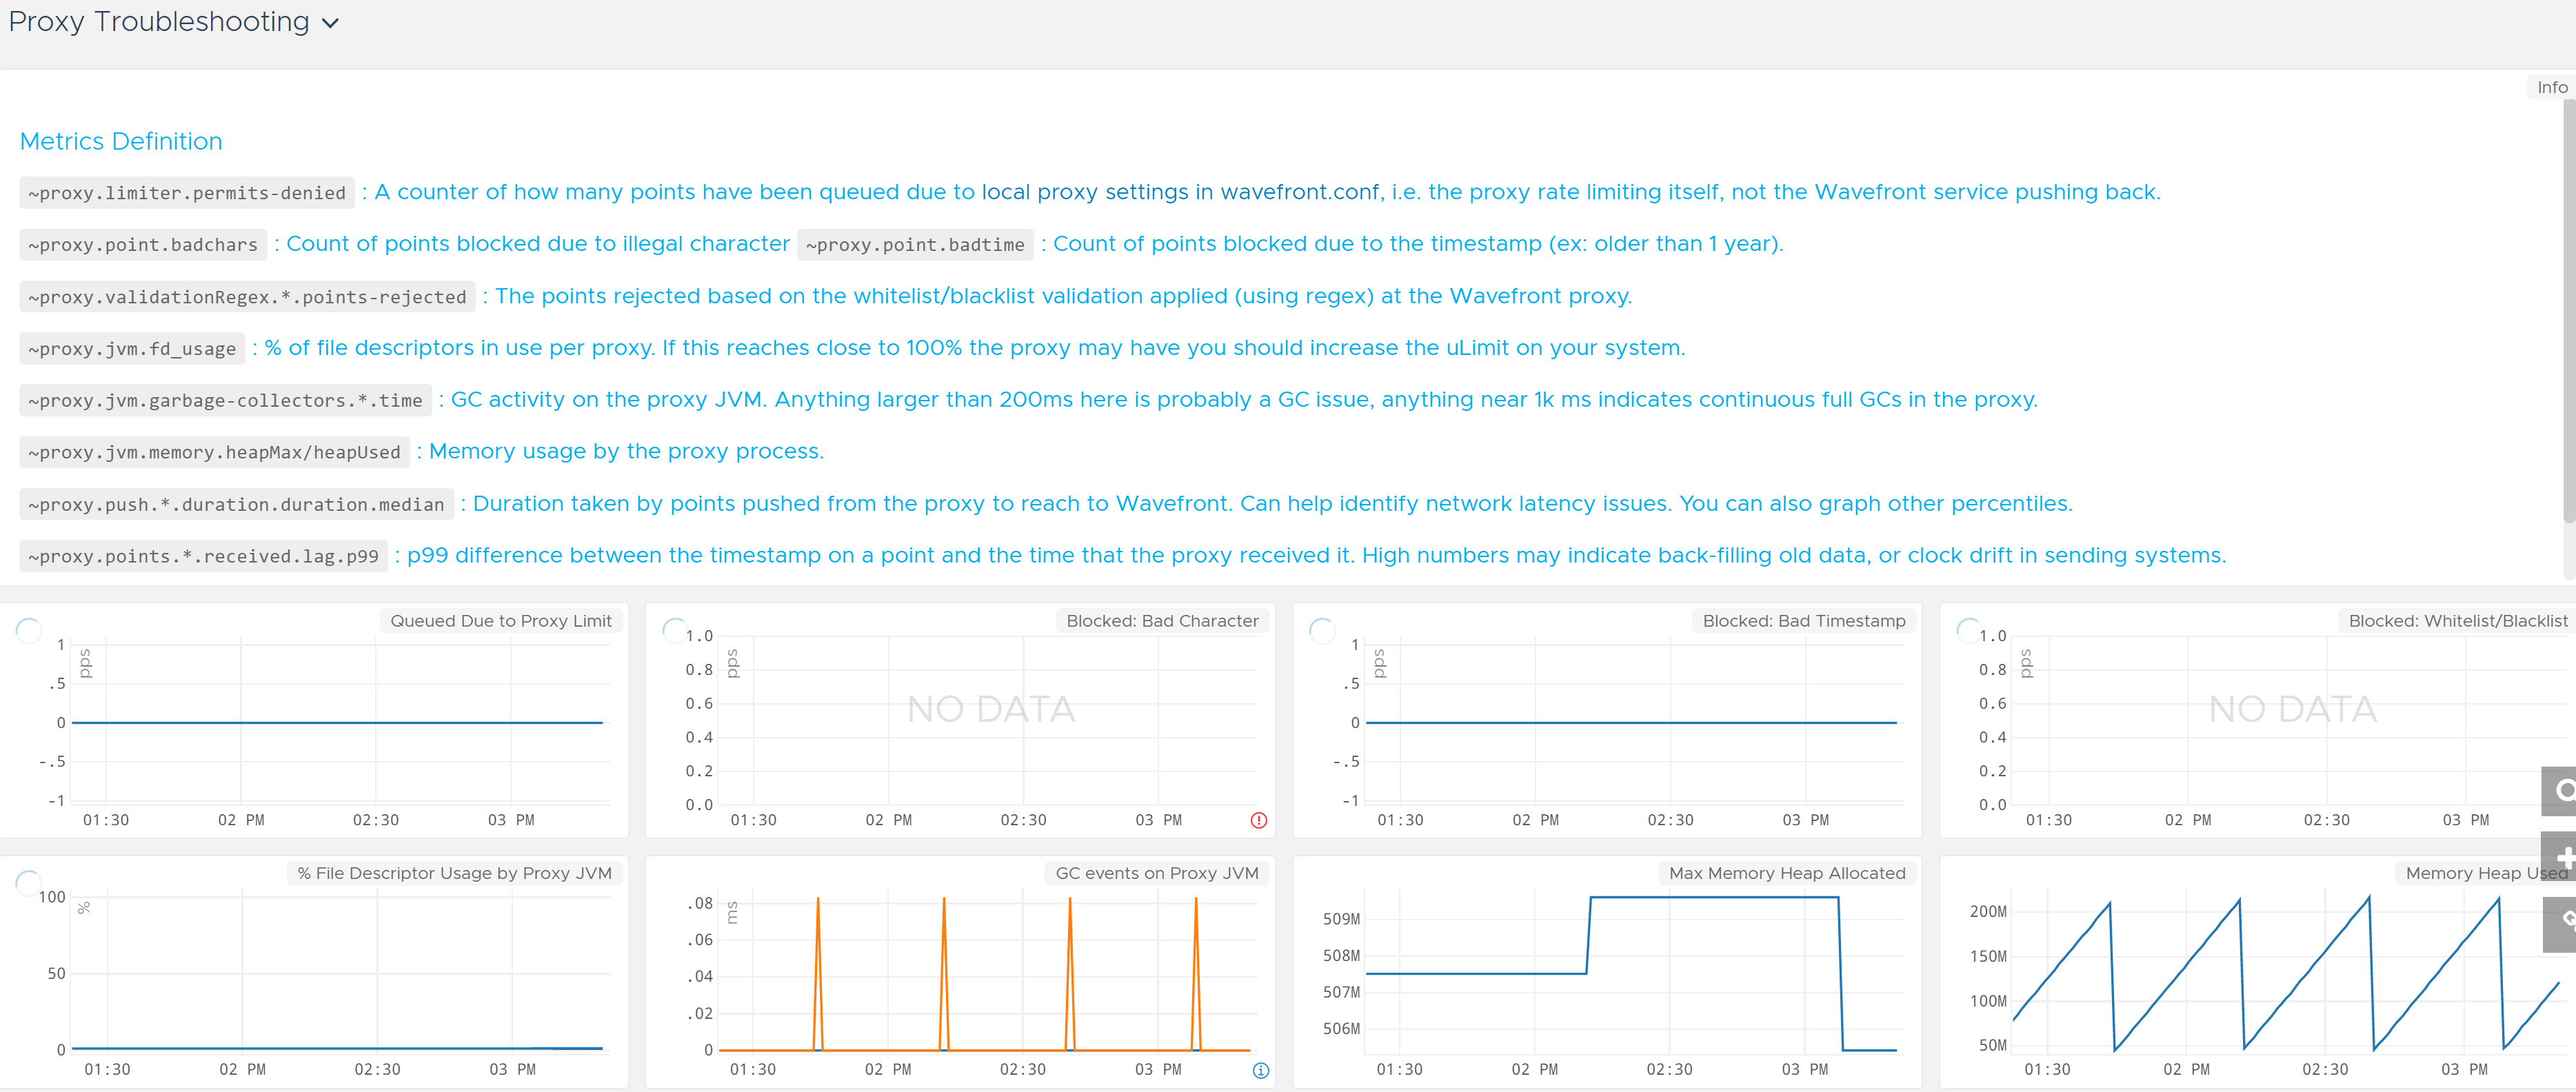
The Proxy Health dashboards (Points, Spans, Distributions) aren’t going to be useful since we are not sending any of those things to Wavefront. Maybe the Proxy Troubleshooting dashboards could help? As shown below, this is mostly about proxy performance. There are additional graphs below the ones in the screenshot, but they don’t tell us anything useful related to whether the proxy received logs.
I won’t go into the other sets of dashboards in this area because they don’t answer the question of whether the logs made it to our Wavefront proxy. I have to say when I found the Wavefront Integration Dashboard, it was pretty exciting. But in the case of this project, this area is just another dead end. There has to be another way. My hope is at some point a Proxy Health section of this integration specifically for log ingestion will be added to aid in troubleshooting.
The Answer Lies in the Metrics?
I hinted in the first post in this series that Wavefront is collecting metrics from the proxy we deployed. Maybe there’s a metric being collected from the proxy that indicates logs are being received that wasn’t shown when we explored the Wavefront Usage Integration.
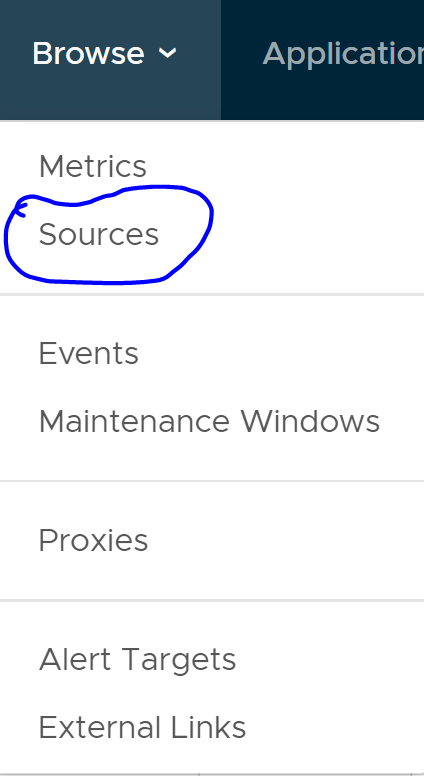
From within the Wavefront interface, go to Browse -> Sources.
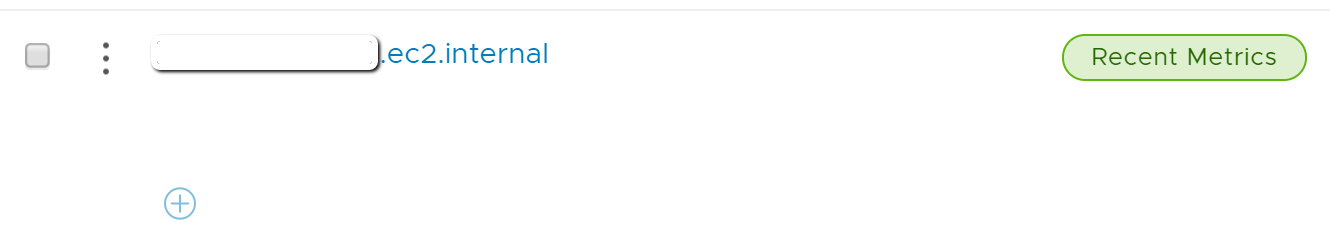
Find the proxy we’ve already setup in the list and click on it. The name should match what we saw in the post-installation observations section of the first post in this series.
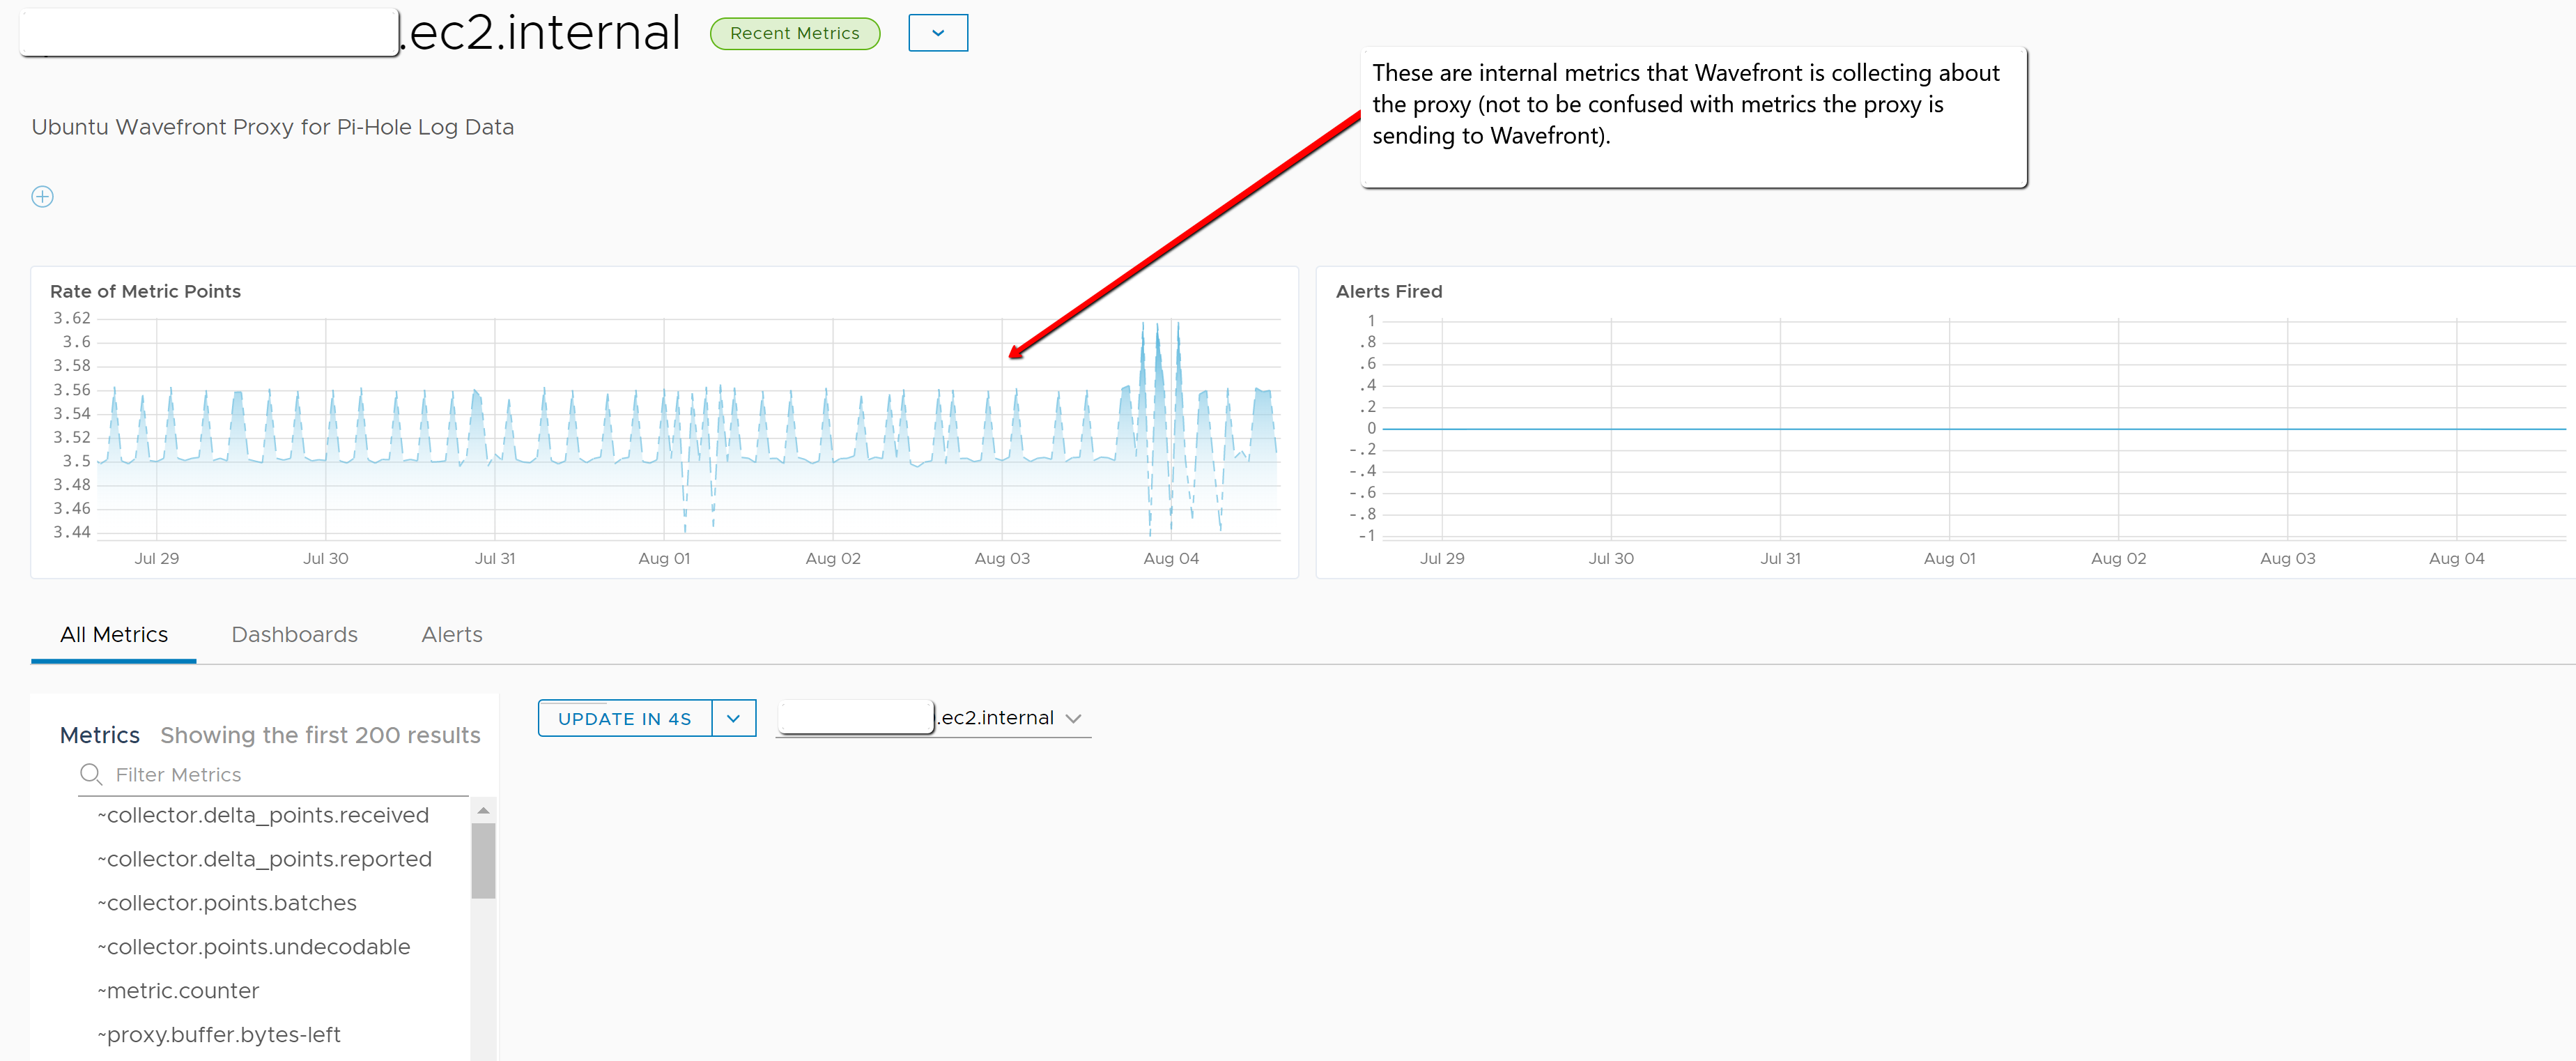
It’s easy to see there are recent metrics to observe from our screenshot below. But we didn’t collect any metrics from the logs yet, right? That’s true, but Wavefront has been collecting metrics about the proxy since it was deployed (called “internal metrics”). This particular screen shows a number of internal metrics. I also recommend taking a look at this document for more information.
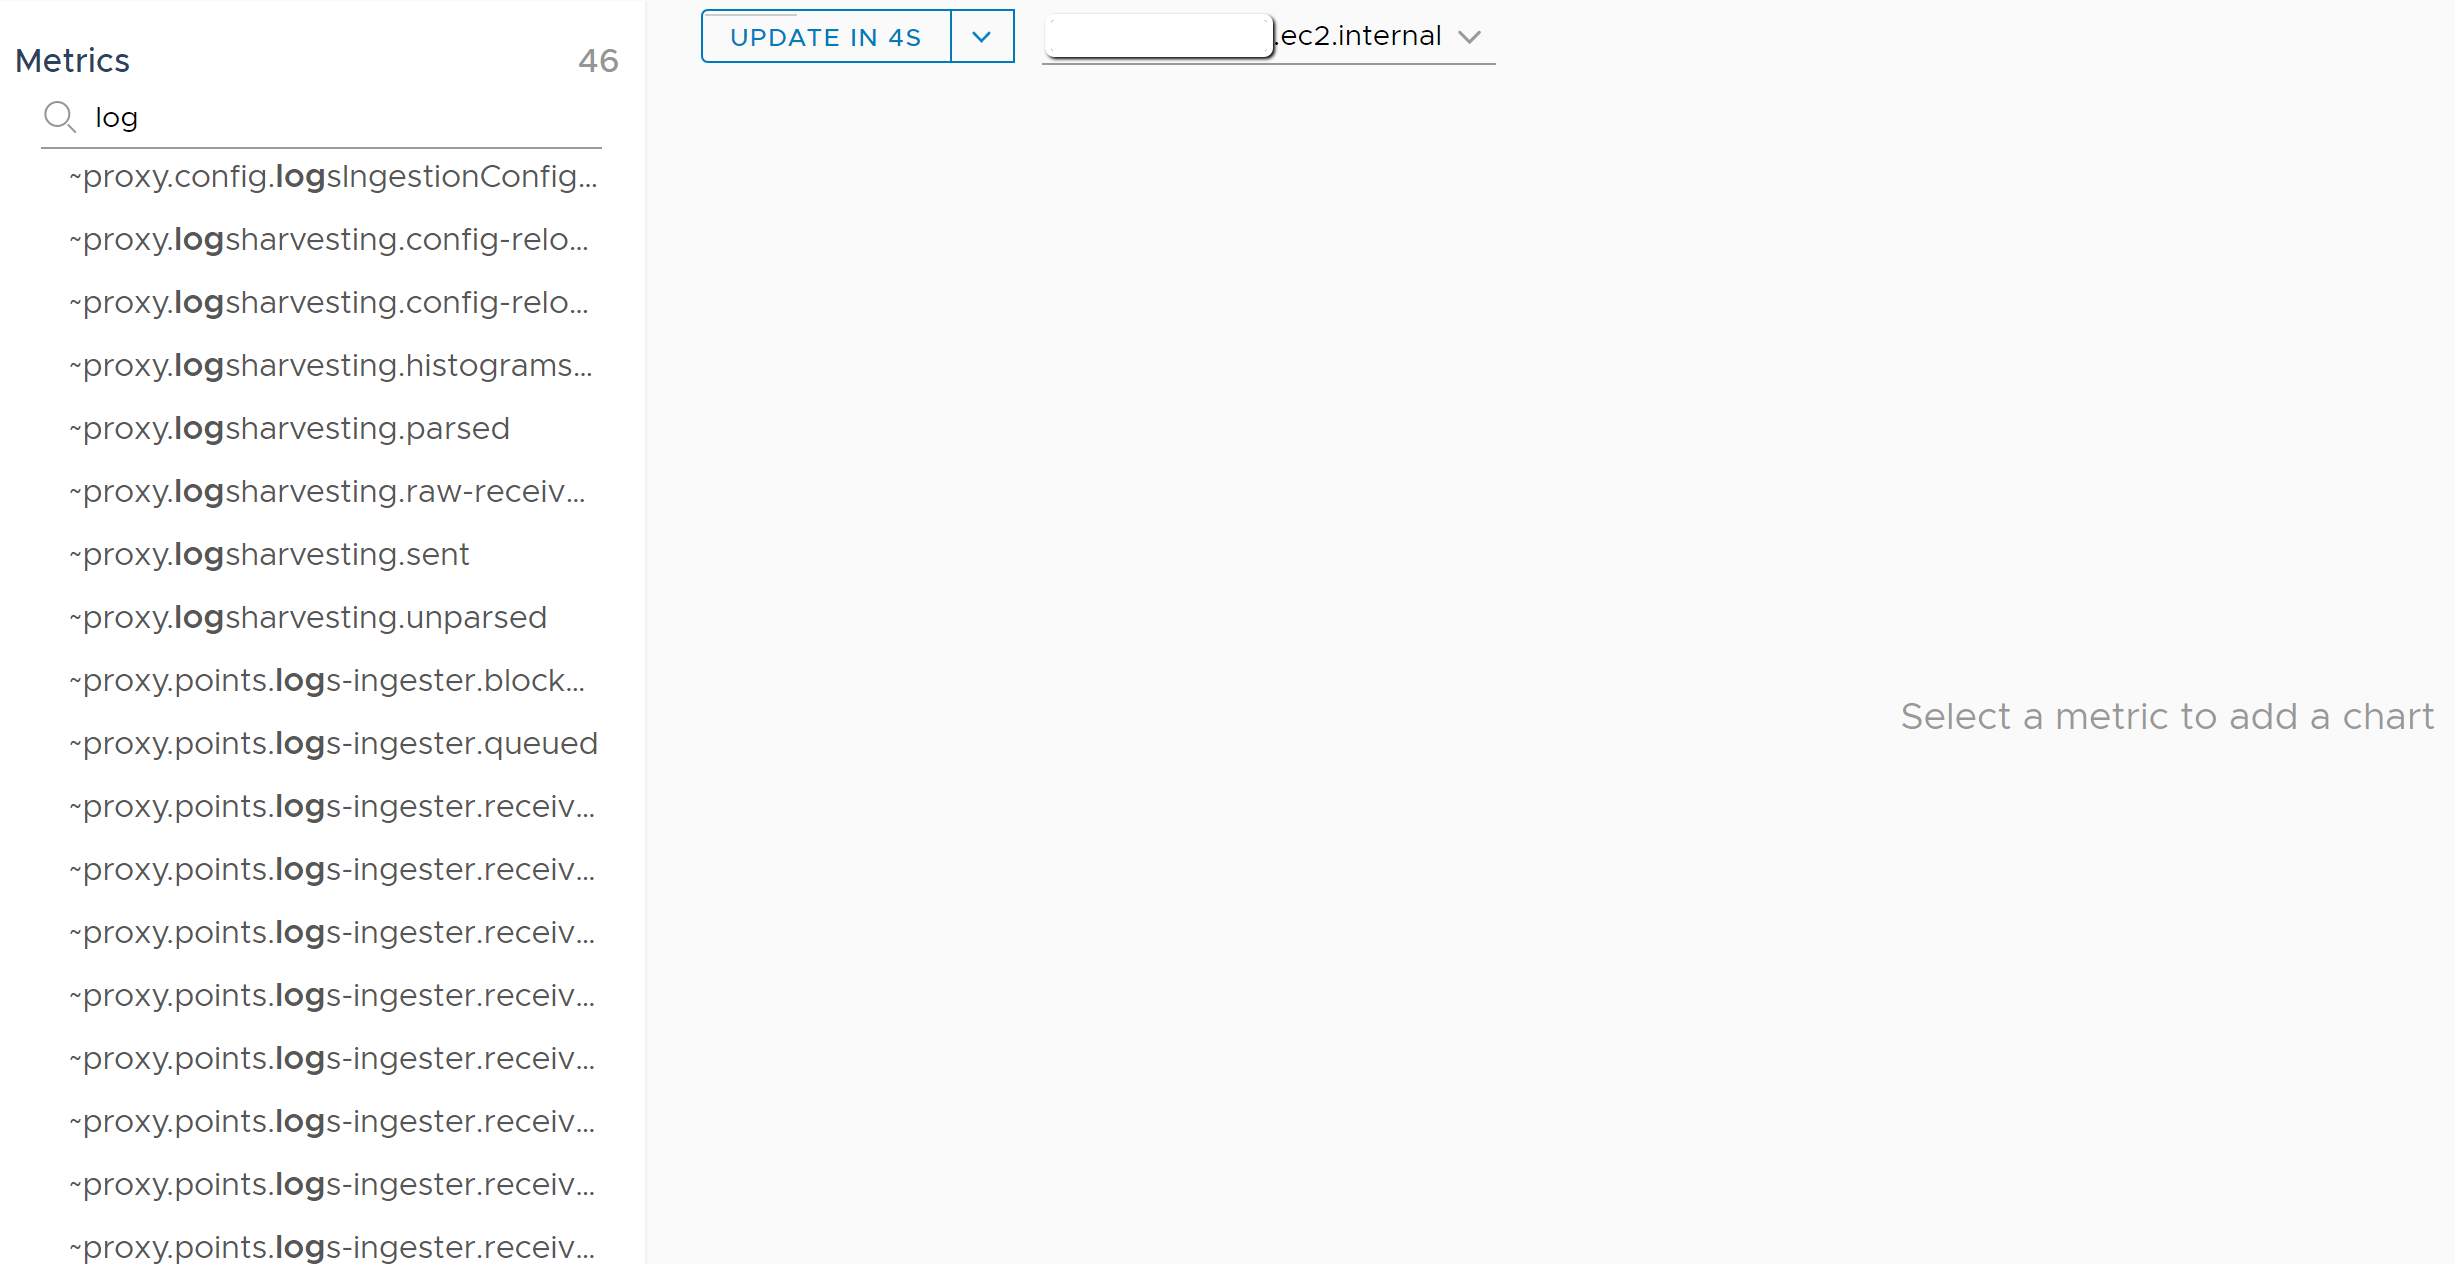
Since we only care about whether logs were received by the proxy, search the Metrics area for log. As shown below, there are 46 metrics (called internal metrics, names of which begin with ~) related to logs reported by this proxy.
As the screenshot above states, selecting any metric in the list will add a chart to the area on the right (which will update every few seconds). For every chart, hover your cursor over any part of the chart to see different options for time frame of data shown (otherwise these options are not visible). If we wanted to zoom in / zoom out on the data, that can easily be done for specific chart with the + or – buttons. As you can see from the chart on the right below, we are looking at a 2 hour time window by default (also the reason you see 2h underlined). The X in the upper right corner of the chart is where you can click to remove the chart from view and deselect it from the metric list. Keep in mind any changes made to the specific time frame shown for a chart stay in place until the chart is either removed or reset (an option you see only after changing the default time frame). Additionally, by clicking on the internal metric name in the upper left-hand corner of the chart, you can look at a larger version of this chart (navigates to a different page inside the Wavefront UI) for deeper analysis.
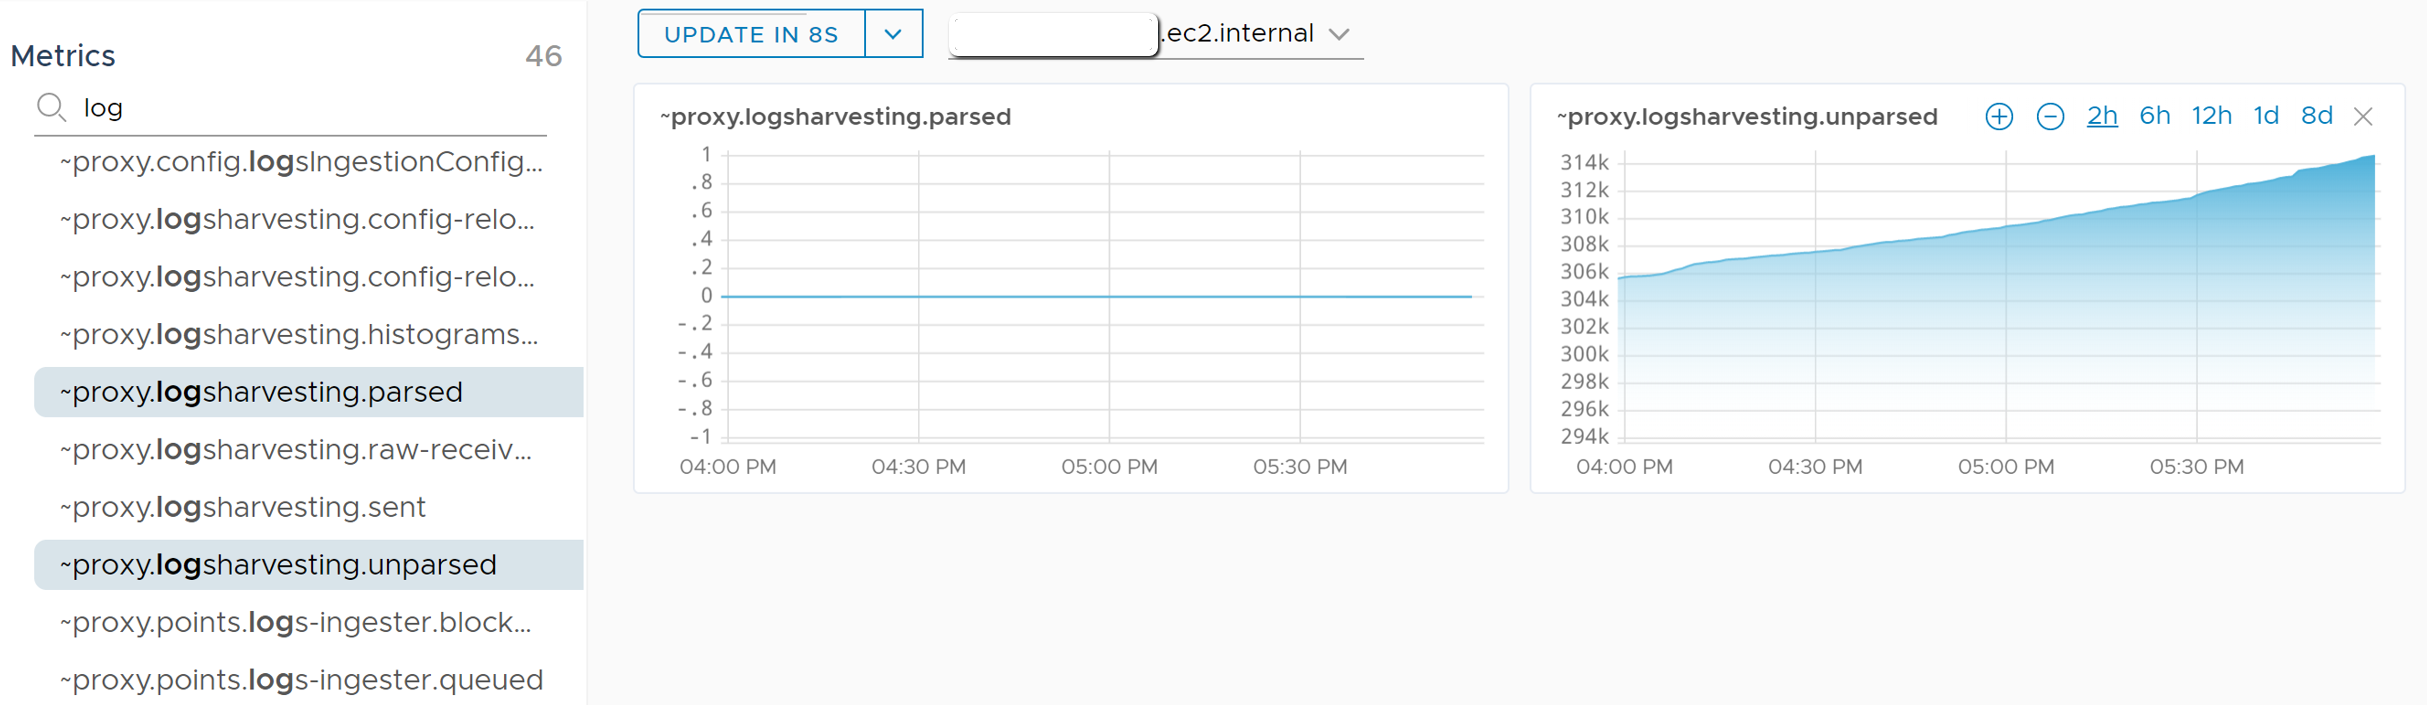
While tinkering in the area above, I found you can select any number of metrics for which you want to see charts. The chart canvas (or grey area on the right of the above screenshot) just gets larger and allows you to scroll down to see more charts (each of them updating every few seconds).
With 46 internal metrics to wade through, there had to be something helpful. Keep in mind every internal metric we discuss here is viewed through the lens of what the proxy itself (our Ubuntu VM) can see / detect. The most helpful metrics I found were these three: ~proxy.logsharvesting.parsed, ~proxy.logsharvesting.unparsed, and ~proxy.logsharvesting.raw-received. The ~proxy.logs-ingester.* metrics were more for counting the number of points (or non-internal metrics) that have been sent by the proxy to Wavefront (currently zero).
As for the 3 internal metrics mentioned, ~proxy.logsharvesting.raw-received should be a count of how many log lines have been received by the proxy. It is not shown here because there was a slight bug in the proxy code at the time of writing. Similarly, ~proxy.logsharvesting.unparsed would be a count of log lines received but not yet parsed (net yet scraped for data to turn into metrics) by the rules added to our logsIngestion.yaml file. Does it make sense that ~proxy.logsharvesting.parsed is holding steady at zero? It should. We haven’t told our Wavefront proxy to parse the logs at all…yet.
Fortunately for us, this finally answers the question “did my logs make it to the proxy?” Now we can definitively say that the logs are making it to the proxy.
An Important Note
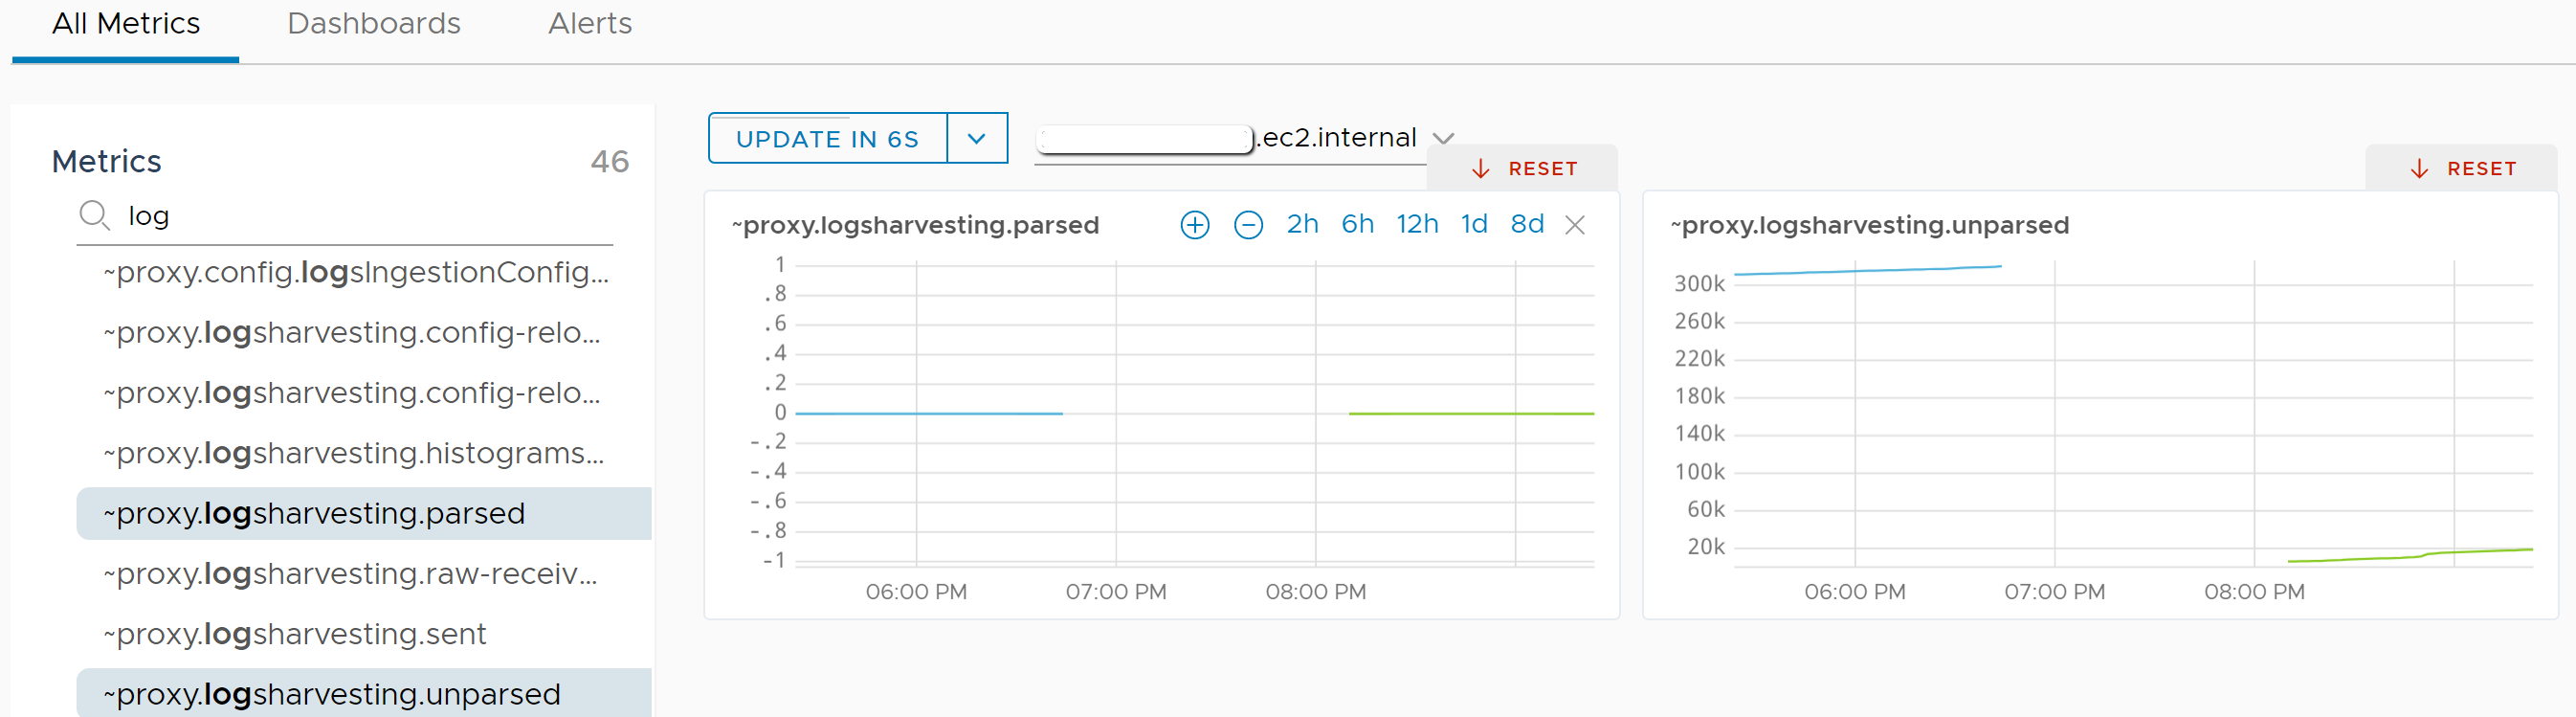
Remember the part of this article where we created logsIngestion.yaml and added a single line to clear some errors related to the wavefront-proxy service? If this particular step is left out of the process, internal metrics for ~proxy.logsharvesting.* don’t populate…at all. So even if you made it to the Sources area mentioned above without having completed that step, it would look like the proxy never received any log data.
Take a look at the screenshot below to illustrate. The gap in the lines on the chart is from the period where logsIngestion.yaml did not exist or was completely empty. Notice also the green line compared to the blue line. The internal metric ~proxy.logsharvesting.unparsed (really just a counter) started back at zero after a restart of the wavefront-proxy service.
In the next post we’ll explore how to turn data from the logs the proxy is receiving into metrics.
Further Reading
This blog is part 3 in a series on analyzing Pi-hole log data with Wavefront. Check out the other posts in the series:
- Part 1 – Creating a Wavefront Proxy in AWS
- Part 2 – Shipping Pi-hole Logs to a Wavefront Proxy
- Part 3 – This post
- Part 4 – Fishing for Wavefront Metrics with Grok Patterns
- Part 5 – Pi in the Sky: Using Wavefront to Analyze Pi-Hole Data
- Part 6 – Coming soon!