Thus far in our series, we’ve successfully shipped pihole.log lines to a Wavefront proxy in AWS EC2 and verified the proxy’s receipt of the logs. No data from the logs is being passed to Wavefront just yet, so it’s time to take a deeper look at the log contents and extract some data to be used as metrics. We’re looking for time series data (or things we can turn into time series data). Tracking the changes over time and the frequency of those changes could give a great deal of insight.
In this blog post, we see a glimpse of how to create metrics from logs. The time series metrics analyzed in that post came from parsing the data inside logs sent to a Wavefront proxy. Based on this document, we can leverage our logsIngestion.yaml file (or the yaml file we chose to specify using the logsIngestionConfigFile parameter in wavefront.conf) on the Wavefront proxy and grok patterns to perform this transformation. These grok patterns form a collective set of rules that determine exactly what data is sent from the proxy to our Wavefront instance’s collector gateway and thus will show up in the user interface.
Before we look at learning grok patterns, it is helpful to look at the logs we’re sending to get a feel for their format and identify important information. The code block shown below is a sample from pihole.log from the Raspberry Pi. As you can see, a number of operations are captured here – replies, queries and which ip address performed them, caches, forwards, and block events. That gives several options for creating time series data when we are ready.
Aug 10 00:00:28 dnsmasq[914]: reply push.prod.us-west-2.prodaa.netflix.com is 2620:108:700f::36ba:fbe5

Aug 10 00:00:28 dnsmasq[914]: reply push.prod.us-west-2.prodaa.netflix.com is 2620:108:700f::36c9:9565

Aug 10 00:00:28 dnsmasq[914]: reply push.prod.us-west-2.prodaa.netflix.com is 2620:108:700f::22d5:5542

Aug 10 00:00:28 dnsmasq[914]: reply push.prod.us-west-2.prodaa.netflix.com is 2620:108:700f::22d5:e8f7

Aug 10 00:00:28 dnsmasq[914]: reply push.prod.us-west-2.prodaa.netflix.com is 2620:108:700f::22d7:5de5

Aug 10 00:00:28 dnsmasq[914]: reply push.prod.us-west-2.prodaa.netflix.com is 2620:108:700f::22d7:8f0d

Aug 10 00:00:28 dnsmasq[914]: reply push.prod.us-west-2.prodaa.netflix.com is 2620:108:700f::3694:3fe9

Aug 10 00:00:28 dnsmasq[914]: reply push.prod.us-west-2.prodaa.netflix.com is 2620:108:700f::3694:eb00

Aug 10 00:00:28 dnsmasq[914]: query[A] push.prod.netflix.com from 10.0.0.5

Aug 10 00:00:28 dnsmasq[914]: cached push.prod.netflix.com is

Aug 10 00:00:28 dnsmasq[914]: cached push.prod.geo.netflix.com is

Aug 10 00:00:28 dnsmasq[914]: cached push.prod.us-west-2.prodaa.netflix.com is 52.35.250.55

Aug 10 00:00:28 dnsmasq[914]: cached push.prod.us-west-2.prodaa.netflix.com is 52.35.1.144

Aug 10 00:00:28 dnsmasq[914]: cached push.prod.us-west-2.prodaa.netflix.com is 52.32.118.157

Aug 10 00:00:28 dnsmasq[914]: cached push.prod.us-west-2.prodaa.netflix.com is 52.26.252.132

Aug 10 00:00:28 dnsmasq[914]: cached push.prod.us-west-2.prodaa.netflix.com is 52.26.41.83

Aug 10 00:00:28 dnsmasq[914]: cached push.prod.us-west-2.prodaa.netflix.com is 52.26.32.201

Aug 10 00:00:28 dnsmasq[914]: cached push.prod.us-west-2.prodaa.netflix.com is 52.39.68.56

Aug 10 00:00:28 dnsmasq[914]: cached push.prod.us-west-2.prodaa.netflix.com is 52.36.236.227

Aug 10 00:00:35 dnsmasq[914]: query[A] watson.telemetry.microsoft.com from 10.0.0.9

Aug 10 00:00:35 dnsmasq[914]: /etc/pihole/gravity.list watson.telemetry.microsoft.com is 0.0.0.0

Aug 10 00:00:35 dnsmasq[914]: query[A] watson.telemetry.microsoft.com from 10.0.0.9

Aug 10 00:00:35 dnsmasq[914]: /etc/pihole/gravity.list watson.telemetry.microsoft.com is 0.0.0.0

Aug 10 00:00:38 dnsmasq[914]: query[A] rdvs.alljoyn.org from 10.0.0.128

Aug 10 00:00:38 dnsmasq[914]: forwarded rdvs.alljoyn.org to 1.0.0.1

Aug 10 00:00:38 dnsmasq[914]: reply rdvs.alljoyn.org is NXDOMAIN

Aug 10 00:00:38 dnsmasq[914]: query[A] rdvs.alljoyn.org from 10.0.0.128

Aug 10 00:00:38 dnsmasq[914]: cached rdvs.alljoyn.org is NXDOMAIN

Aug 10 00:00:40 dnsmasq[914]: query[A] api-global.netflix.com from 10.0.0.5
But, young Skywalker, you are not a jedi yet. Before we can create any time series data from these logs, we need to dive into grok.
What Exactly is Grok?
Interestingly enough, the word grok was first introduced in a book called Stranger in a Strange Land by Robert A. Heinlein (more on that here). One definition of the term grok is “to understand intuitively or by empathy.” But, as also seen in the link provided above, “one of the most powerful parsing filters used in ElasticSearch software’s Logstash component is named grok.” So the question now becomes, can we grok grok? Hopefully by the end of our explorations the answer is yes.
Grok is a parsing filter based on patterns. If I filter information, that means I narrow the focus to only look at what is most important. In our case, important items will be specific data from logs that can be used as metrics. In Wavefront (as in Logstash), data is parsed from logs based on grok patterns. A grok pattern is a data format description. For example, there are grok patterns for things like ip addresses (both ipv4 and ipv6), host names, file paths, usernames, and many more. Consider the specific format of an ipv4 address in your mind. The grok pattern for an ipv4 address is defined this way:
IPV4 (?<![0-9])(?:(?:25[0-5]|2[0-4][0-9]|[0-1]?[0-9]{1,2})[.](?:25[0-5]|2[0-4][0-9]|[0-1]?[0-9]{1,2})[.](?:25[0-5]|2[0-4][0-9]|[0-1]?[0-9]{1,2})[.](?:25[0-5]|2[0-4][0-9]|[0-1]?[0-9]{1,2}))(?![0-9])
If that syntax gives you a headache, I definitely understand. The beauty of this grok pattern is that I can use it to identify and parse an ipv4 address from a single line of text in a log file. I don’t have to know how to detect whether there is an ipv4 address in my log file. I can use the grok pattern to do the detective work for me and return the ip address (or some other value I want) for further analysis. In the case of the Pi-hole logs, you can easily see above that requests are being made by different ip addresses on my home network. What if we could count the number of times each ip address makes a request and track those over time? Grok patterns can help here, but we’ll have to first learn proper syntax.
Some of the grok syntax basics can be found here, but that wasn’t enough for me. There is also a Grok debugger with links to a number of grok patterns for reference, but this list of grok patterns is supported by Wavefront proxies. Notice these are a fork of Logstash grok patterns. I recommend looking through the supported patterns before trying to use them. Per the Wavefront documentation, there is potential to add new grok patterns if we want, but take baby steps with me for now. I found this post extremely helpful in learning the basics of grok patterns.
Grok Patterns and the Parsing Process
Suppose we want to use grok patterns to parse a single line from a log file. There may be many log lines that look different, and this is only a single example. It’s important to look at the unique format of log lines to determine what grok patterns might be needed for different types of log lines. Here’s a sample from the above log snippet:
Aug 10 00:00:28 dnsmasq[914]: query[A] push.prod.netflix.com from 10.0.0.5
When we think about what to consider important information from this line from pi-hole.log, what stands out? To me, the ip address of the device making the query is important. The fact that a query was made is important (especially if I wanted to track number of queries over time). And potentially the domain queried is important. I don’t really care about the time stamp. Yes, it’s important, but if I want to create a metric based on some value from this log line, Wavefront will add the time and date automatically when I send it a data point from the proxy (which we are not yet doing).
Parsing of this log line goes from left to right either one character, word, or phrase at a time. Let’s play with the Grok debugger a little now to see how this works. What grok patterns can we use to pull out the important data mentioned earlier? Getting all the way to the ip address at the end of this line means parsing out everything else until we get there. It doesn’t necessarily mean we have to use every value as a metric.
If we look back at the list of supported grok patterns, there is a grok pattern for DATE. Would that work? The grok pattern for DATE is defined this way:
DATE %{DATE_US}|%{DATE_EU}
That grok pattern is a combination of the one for DATE_US and DATE_EU. So anything matching either of those grok patterns should be successfully parsed.
DATE_US %{MONTHNUM}[/-]%{MONTHDAY}[/-]%{YEAR}

DATE_EU %{MONTHDAY}[./-]%{MONTHNUM}[./-]%{YEAR}
But after looking at those pattern definitions, the data in our log file does not match this format. I suspect there will be no pattern match, but let’s try it in the debugger anyway. We use the syntax %{DATE} to reference the appropriate grok pattern (% symbol followed by name of grok pattern inside of curly braces).
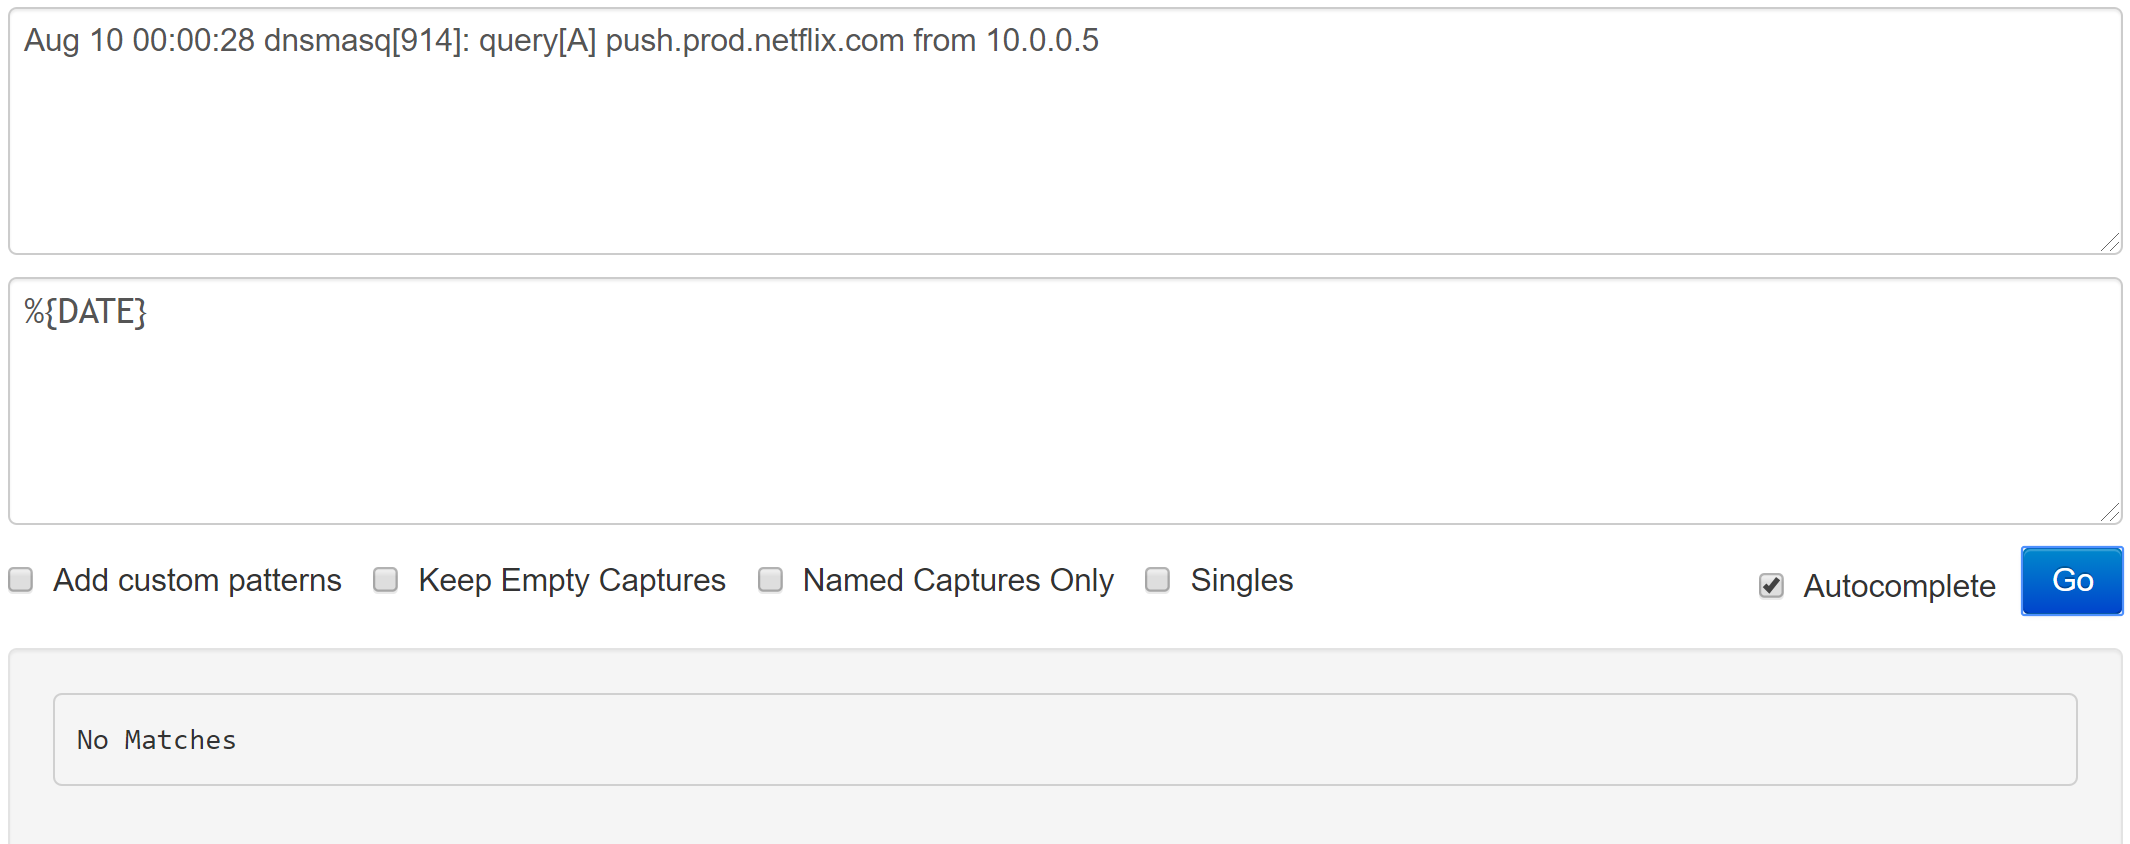
As we saw, there was not a successful match to this pattern. Maybe we need to try something else. What about MONTH? Here’s what the pattern looks like:
MONTH \b(?:Jan(?:uary)?|Feb(?:ruary)?|Mar(?:ch)?|Apr(?:il)?|May|Jun(?:e)?|Jul(?:y)?|Aug(?:ust)?|Sep(?:tember)?|Oct(?:ober)?|Nov(?:ember)?|Dec(?:ember)?)\b
This looks promising, so let’s give it a try in the debugger using proper syntax.
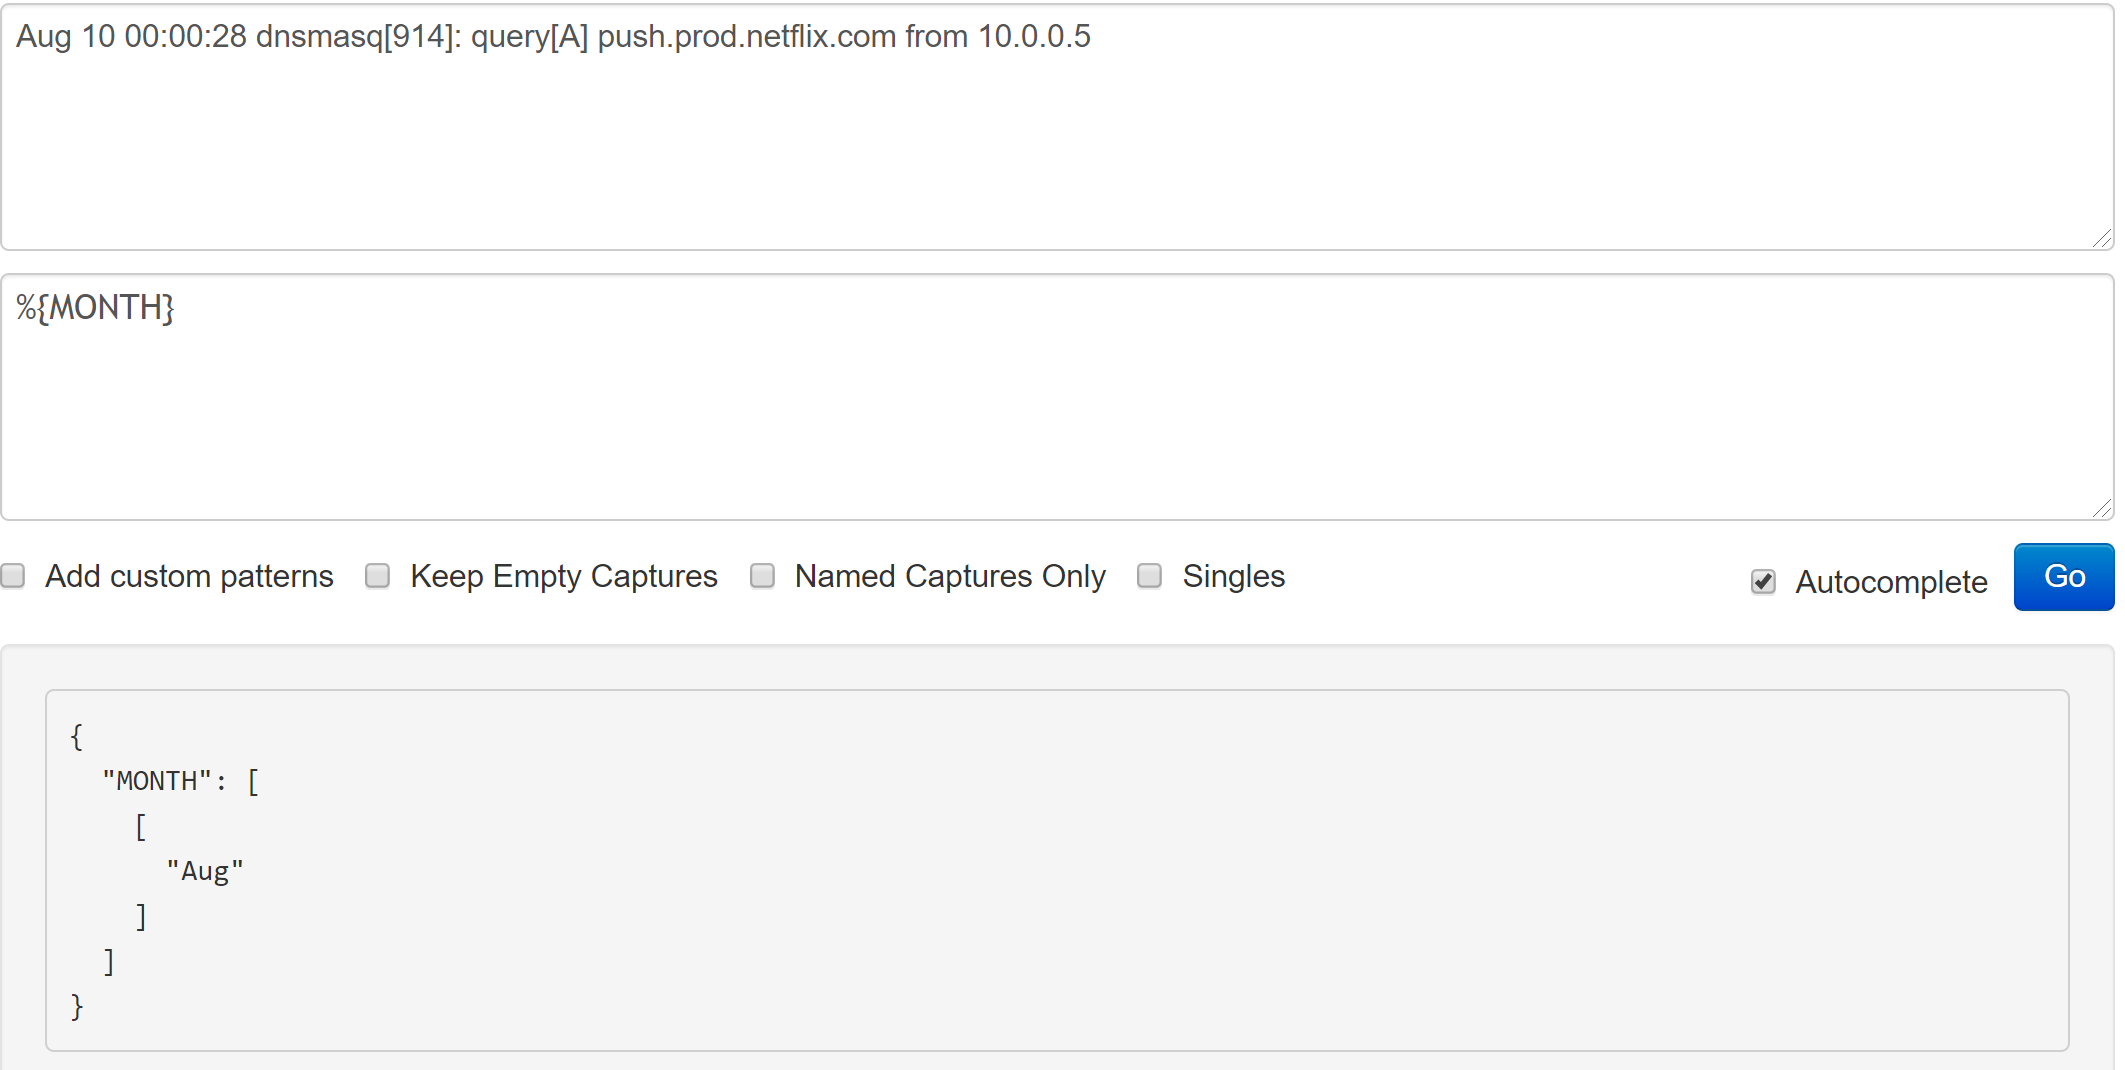
The pattern MONTH was matched, so “Aug” was parsed out of the log line successfully. But don’t stop there. Now we need a pattern to match the 10, which is actually a day of the month. Then, 00:00:28 is a time. What if we try MONTHDAY and TIME for those patterns? I won’t show those pattern definitions, but you can find them here for reference. The specific syntax to call these patterns in addition to the first one we used will be as follows: %{MONTH} %{MONTHDAY} %{TIME}
Notice each pattern has proper syntax and is separated by a space. Since the information inside the log is separated by a space as we move from value to value, forgetting to leave a space when applying multiple patterns will result in compilation errors. Did it work?
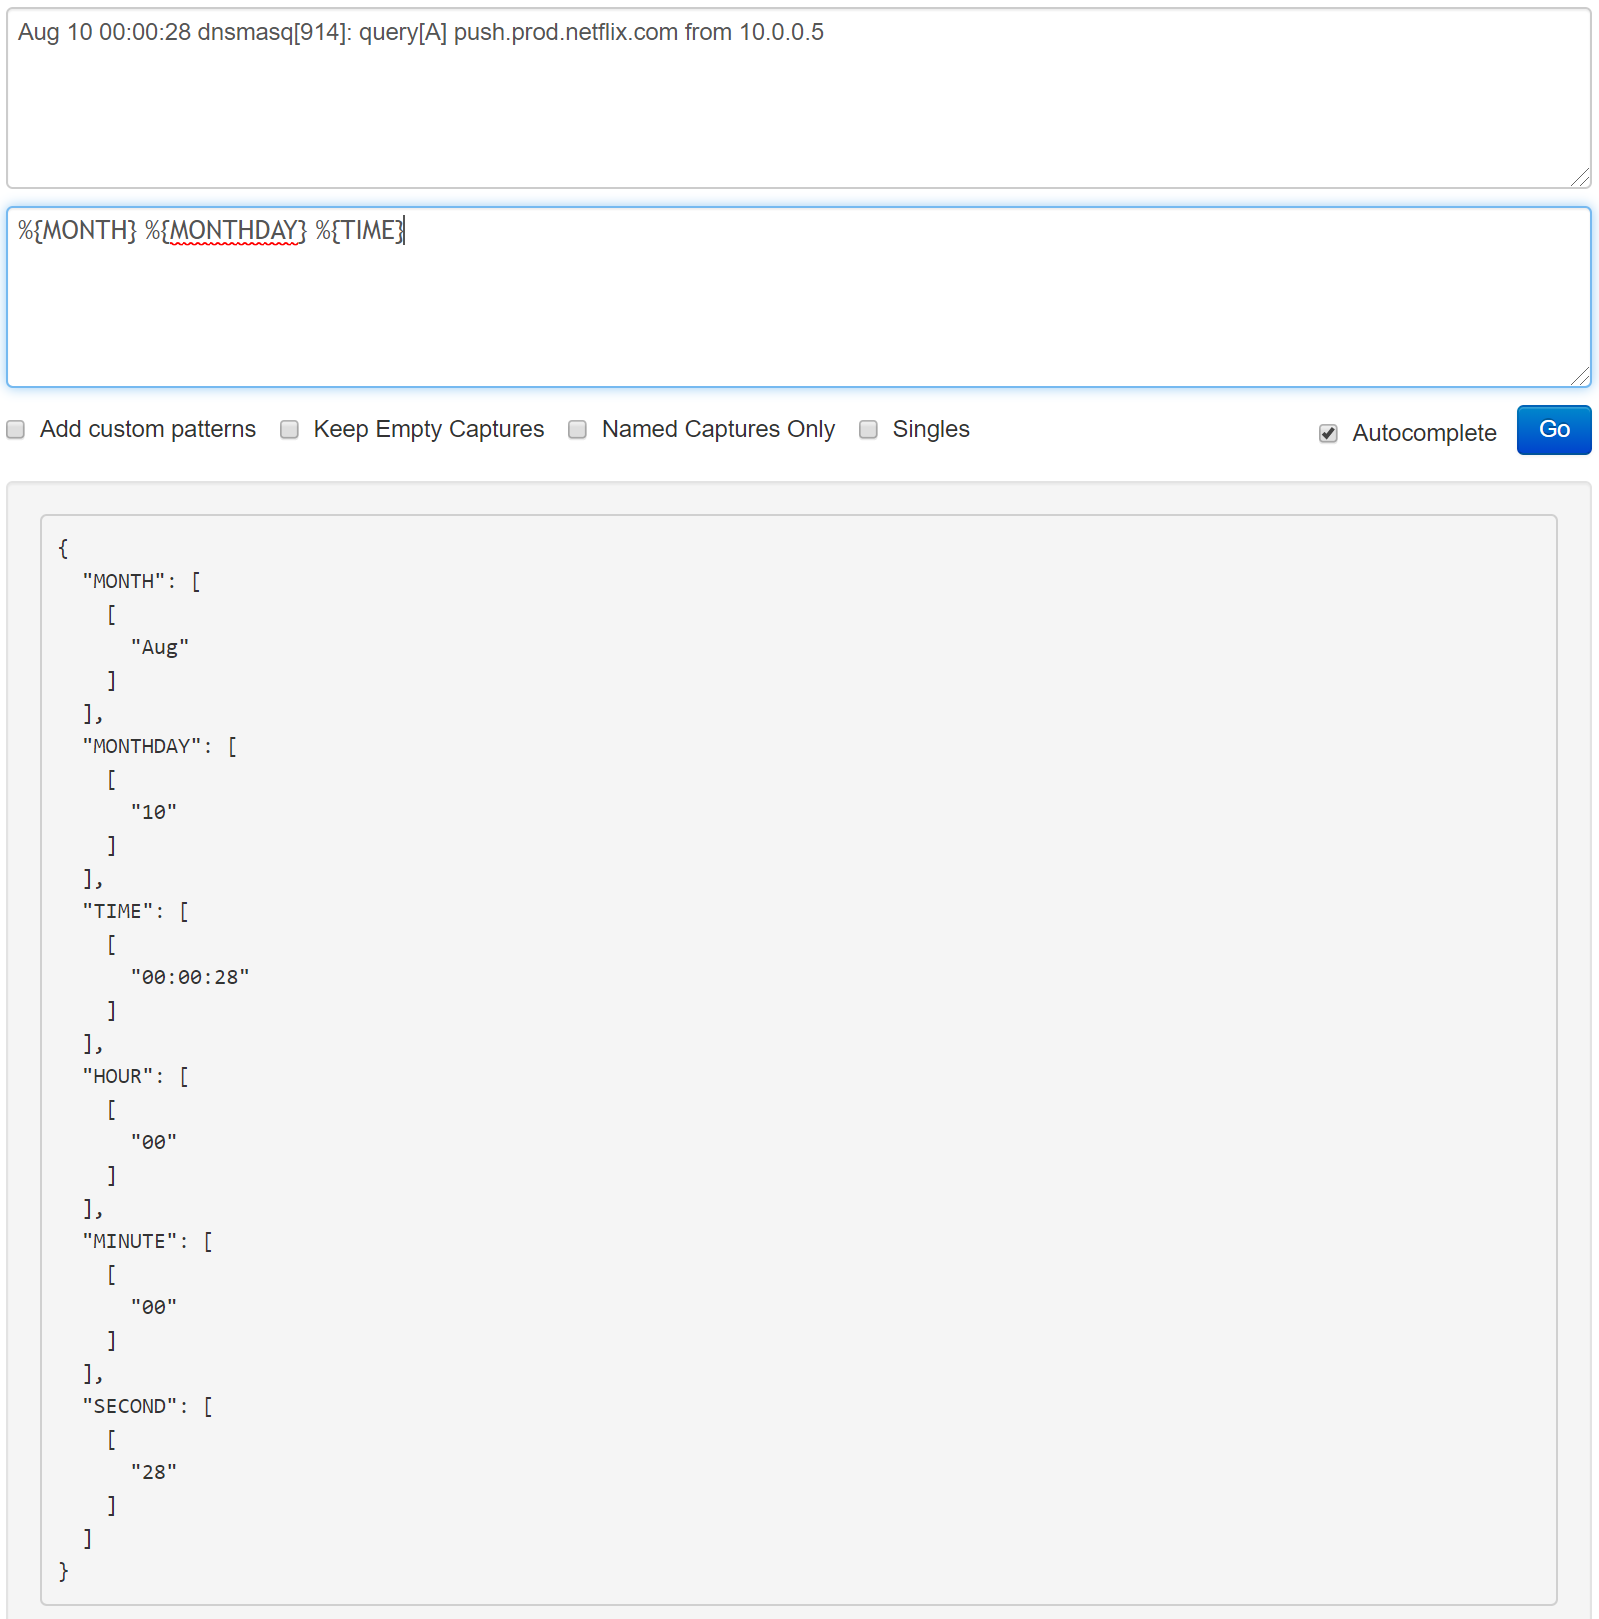
Based on the screenshot above, we’ve parsed all the way to the 28. Since the grok pattern TIME was defined using the grok patterns for HOUR, MINUTE, and SECOND (think of these as subpatterns) we see the data listed together as a time (“00:00:28”) but also broken out for each subpattern. If hours, minutes, or seconds were of particular interest, we could have used those patterns separately. But at the moment, we’re trying to get to the interesting stuff.
The next part of the log line is dnsmasq[914]: query[A] What can we add to parse this out? Try the following:
%{MONTH} %{MONTHDAY} %{TIME} %{WORD}\[%{NUMBER}\]\: %{WORD}\[%{WORD}\]
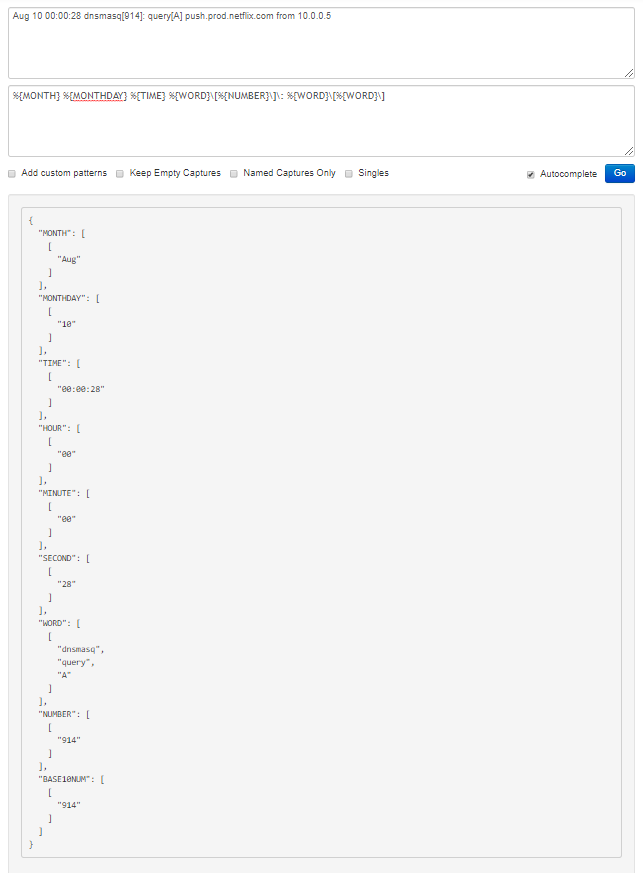
Notice what was added to the three patterns we used earlier. There are more familiar patterns added, but the bracket characters as well as the colon were easier to deal with than I thought. From what I learned, if you want to pick out a single character like a colon or bracket, add a backslash (\) followed by the actual character. Adding multiple characters after the backslash also worked (such as \]:) even though that is not shown in the screenshot or syntax above. But again, notice the position of spaces. If there was a space in the log file, we need a space in our listing of grok patterns.
Look at something else in the debugger output. We used the WORD pattern multiple times, and because of that, all matching values are listed in what looks like an array in the output. We can use identifiers to separate the values returned from a pattern match to give our output more meaning. The proper syntax to use here would be %{GROKPATTERN:SEMANTIC} with the SEMANTIC portion being an identifier that you choose. When doing this kind of thing, you get to choose whether to add an identifier to each grok pattern. Notice in this post the writer only uses identifiers for data considered important, and I think that is a good rule of thumb.
Let’s take two steps at once now. I’m going to show the entire set of grok patterns to parse that log line and include some identifiers for important pieces of information we identified earlier.
%{MONTH} %{MONTHDAY} %{TIME} %{WORD}\[%{NUMBER}\]\: %{WORD:RequestType}\[%{WORD}\] %{HOST:Domain} %{WORD} %{IP:DeviceAddress}
The output from this in the debugger is pretty long, so I’ll paste it instead of including a screenshot this time:
{
  "MONTH": [
    [
      "Aug"
    ]
  ],
  "MONTHDAY": [
    [
      "10"
    ]
  ],
  "TIME": [
    [
      "00:00:28"
    ]
  ],
  "HOUR": [
    [
      "00"
    ]
  ],
  "MINUTE": [
    [
      "00"
    ]
  ],
  "SECOND": [
    [
      "28"
    ]
  ],
  "WORD": [
    [
      "dnsmasq",
      "A",
      "from"
    ]
  ],
  "NUMBER": [
    [
      "914"
    ]
  ],
  "BASE10NUM": [
    [
      "914"
    ]
  ],
  "RequestType": [
    [
      "query"
    ]
  ],
  "Domain": [
    [
      "push.prod.netflix.com"
    ]
  ],
  "HOSTNAME": [
    [
      "push.prod.netflix.com"
    ]
  ],
  "DeviceAddress": [
    [
      "10.0.0.5"
    ]
  ],
  "IPV6": [
    [
      null
    ]
  ],
  "IPV4": [
    [
      "10.0.0.5"
    ]
  ]
}
Notice I’ve added some identifiers for the information we flagged as important – RequestType, Domain, and DeviceAddress. Think of those identifiers almost like variables or fields that hold our important information after the grok patterns were applied. You can see from the output above what each field contains now. We will use this information to create Wavefront metrics…but not yet.
Grok Patterns…Wavefront Style
It’s important to realize the way grok patterns get applied in Wavefront is very similar to Logstash documentation but also different. In the next post we’ll talk about how grok patterns can be used inside logsIngestion.yaml to create metrics based on the information from logs we decided was most important. We’ll also talk about the different type of metrics Wavefront can create from log data and how to choose the right one. Be patient, dear reader. We’re getting there step by step.
Further Reading
- Part 1 – Creating a Wavefront Proxy in AWS
- Part 2 – Shipping Pi-hole Logs to a Wavefront Proxy
- Part 3 – Verifying Wavefront Proxy Log Ingestion
- Part 4 – This post
- Part 5 – Pi in the Sky: Using Wavefront to Analyze Pi-Hole Data
- Part 6 – Coming soon!