This is part 6 of my quest to explore Azure Functions for self-education in functions-as-a-service. The goal of this post is to successfully integrate VMware’s Tanzu Observability (AKA Wavefront) with Azure and explore the additional insights gained for our Azure Function environment.
Back in part 1, we explored Azure Functions and Function Apps via the Azure portal. In part 2 we explored deploying function code to Azure directly from VS Code. In part 3 we wired up VS Code with source control using Azure Repos but didn’t make it to Azure Pipelines. In part 4 we explored some differences in C# and C# script code that pop up when creating / editing Azure Functions in the Azure portal compared to leveraging VS Code which are foundational for getting Azure Pipeline settings correct. In part 5 we configured and tested basic CI/CD for Azure Functions using Azure Pipelines based on a code change to an Azure Repo. Now that we’ve reviewed the progress made thus far, let’s get to it!
Fun with Product Names
Names are fun, aren’t they? The product we’re talking about in this post was originally called Wavefront and was recently renamed Tanzu Observability by Wavefront. Within this post, you may see either of those terms used to refer to the same SaaS (software-as-a-service) product. I guess it will always be Wavefront to me.
The following steps assume you have a Wavefront instance readily available as well as one or more Azure subscription(s).
Inside the Wavefront Interface
After logging into Wavefront, click on the Integrations menu.

There are many integrations available, but we want Azure specifically. Type azure in the search box. As you type, a list of options will appear. There are a number of services specific to Azure we could choose, but they will all direct you back to the main Microsoft Azure integration. Click on Microsoft Azure to proceed.

At this point you should see only the Azure tile in your results. Click on it to proceed.

We’ve now reached the main Microsoft Azure integration page. Notice all the icons for Azure services this integration supports. The overview section tells us a bit more about what the integration does and provides some screenshots as examples. But as mentioned, let’s find out if it works. Click on the Setup option.

There are currently no Azure integrations configured as shown below, but what’s this message about permissions? Maybe we should verify we have the right permissions before proceeding.
NOTE: This message may show even if you do have the proper permissions. But let’s be thorough for demonstration purposes.

Checking the Permissions
In order to check permissions, find the settings cog in the upper right-hand corner of the Wavefront interface, and click on it. Then select Account Management.

This brings us to a list of user accounts setup inside Wavefront. Click on the one you used to login. In my case it was the second one in the list.

As shown below, this specific user account has Proxies permissions, so there is no need to make an update. We can continue adding the integration.

Back to Adding the Integration
Navigate back to the Setup area for the Microsoft Azure integration, and Click the Add Integration button. The permissions message may or may not have disappeared at this point. If you have verified permissions as we did above, all should be fine to continue.

I’ve only given the integration a name at this point (Nick’s Azure Metric Playground) but nothing else just yet. Clicking on “How to get the Directory ID” gives nice directions on what we should do to get that information.

Inside the Azure portal, select Azure Active Directory as shown here.

This takes us to the Overview page for Azure Active Directory. The Tenant ID is shown on this page, but I wasn’t sure that was the correct field at first. The Properties option in the left-hand menu is another area to check.

Now copy the Directory ID for pasting into Wavefront.

The next step is getting the Application ID for the integration settings.

Back in Azure, click on App registrations in the left-hand pane as directed. In this case there are no applications registered. The only way forward is to click Register an application.

The Wavefront integration settings page points us to this Microsoft doc on creating an Azure AD application that can help with what comes next. I named the application Wavefront Integration and left the default settings in place. I was not certain if a Redirect URI was needed for the integration and left that blank for now. Click Register to continue.

As we can see from the screenshot below, the application registration was created, and we can grab the Application ID to plug into the Wavefront integration settings.

Now that we have the Application ID, we need to assign the Reader role to the application per this Microsoft doc. After navigating to All Services -> Subscriptions, we can see that there is only one subscription from which to choose. Be sure to choose the correct one at this step. Someone reading this may want data for Azure services that exist in multiple subscriptions, so keep in mind the steps may have to be repeated or might be slightly different for leveraging multiple subscriptions.

After clicking on the subscription name, click Access control (IAM) followed by clicking the option to add a role assignment.

The role we choose will be Reader, and we’re assigning access to Azure AD user, group, or service principle. In the Select box, once we start typing the name of the application we registered (Wavefront Integration), it will show up in the results list as an option to select. Nothing appears unless we start typing.

After selecting our Wavefront Integration application, click Save.

Once this operation succeeds, we’re ready to get the Application Secret needed for our integration settings. Here’s a shot of where we are now. Again, we have some instructions to guide this process.

Since the application secret we need was never created, we go back to the App registrations area for the Azure AD service and click on the Wavefront Integration application.

Click on Certificates & secrets followed by clicking the New client secret button.

Add a brief description, and select the expiration time period. I stuck to 1 year in this case. Click Add to continue.

Now we have an auto-generated client secret. This expires in one year and will be used only for our Wavefront integration. Click the copy option so this value can be pasted into the integration settings area shown previously.

After adding the Application Secret in Wavefront, that is the last required field we need. Every other setting is optional. It would be possible to fill these in to narrow the scope to specific resource groups, but I chose not to do it. I did select the Activity Log option, however (not required). Now click Register, and let’s see what happens!

Verifying Success
After clicking Register, we should see a success message in the upper right corner of our browser window like this one.

In addition to this, we will be redirected to the Microsoft Azure Integrations Setup area. Notice our integration is now listed here. Clicking on the name of our integration takes us back to the settings page modified in previous steps. So, if at any point settings related to the integration need to be changed, we know where to go to change them. Notice in the screenshot below we have two types of integrations available (due to checking the Activity Log in the box above).

If we click the Advanced option from the screenshot above, we can see that the integration state is indeed active and that metrics have already been collected. That is proof the integration is working. If we left our browser on this page, it would auto-refresh as new metrics are received from Azure. Keep in mind also the integration collects metrics for many different services in Azure, so the metrics shown below could vary quite a bit based on the Azure subscription(s) connected via the integration and service usage. For our purposes here, the scope is confined to a few Function Apps and some HTTP Trigger functions.

Let’s go to Browse -> Sources for a second to get details on exactly what is passing in metrics.

Since the instance of Wavefront I’m using is shared, there are many sources here that are not from our Azure integration. If you remember from the first post in this series when we created some functions in the Azure portal, we had to create a Function App, a storage account, and we chose to add application insights to each one. Interestingly enough, each of those will show up here as sources of metrics. Search the Sources area for networknerd (type it and press enter to kick off the search). Since networknerd was part of our naming convention, we see familiar names of Function Apps (networknerd0, etc.), storage accounts (networknerd0storage, etc.), and application insights (networknerd0appinsights). Each has sent recent metrics to our Wavefront instance, and we can see the rate of points per second as well as that these sources are considered new. The menu on the right helps us understand what Wavefront considers a source.

Clicking the SAVE option above will save the search for later use if needed. Additionally, searching for one of the specific functions we created (all started with a name of FN) returns nothing (i.e. not considered a source for Wavefront metrics). Remember also that one or more functions exist within each Function App, so it would make sense that the metrics for the functions themselves might roll up and be presented through metrics of the Function App.
Suppose we decide to find the true answer. Let’s click on Function App networknerd0 and see what the metrics tell us.

What we see below is not much. As we would expect with the integration just configured, the rate of metric points received shows nothing until the very end of the chart. We see no alerts fired in the chart on the right. At the bottom of this page we see a list of 121 different metrics on the left and can click on one or more of them to auto-create a real-time graph for that metric on the canvas to the right.

What if we zoom in on the chart for Rate of Metric Points to show that last part a little clearer? On any chart we see, we can left-click our mouse and hold it to highlight the area of the chart we’d like to see in more detail. Once a section of the graph is highlighted like the purple area in the graph below, release the mouse button.

This will immediately generate a new graph for only the time period we selected. Notice the rate of metric points coming into Wavefront from the Function App networknerd0 was greater than zero only during the time period from 12 PM to about 1 PM. Both before and after that, we see no value for the rate of metric points.

Before showing these charts, I went into Azure, started the Function App networknerd0 and enabled both functions inside it (screenshot shown below for context). Then I executed each one a few times to generate metrics.
What if we zoom in again on the chart above for that time period from 12 PM to 1 PM? Notice we can put the cursor somewhere on the newly zoomed in chart (or any chart) and see the value of the metric at that point. Notice also on this chart as we move our cursor across it there are some options below the RESET button (puts chart back at default time period) to zoom in, zoom out, or change the chart time period to 2 hours / 6 hours / 1 day / 8 days.

Remember that list of metrics in the lower left we saw earlier? What if we search for function and see what metrics are there? Keep in mind we’re searching by metric name, and the metrics come from Azure Monitor. The full list of metrics for Functions / Function Apps that get pulled in can be found here. As you can see from searching the metrics list on the left, there are 10 metrics whose names contain the word function. I clicked on all of them to show on the chart canvas. But if we look specifically at the one for functionexecutioncount.count, this metric is counting the aggregate number of times functions within Function App networknerd0 is executed in the time window below.

It appears we have a couple of different points in time when functions within this Function App were being executed.

The popup below shows the lines on the graph represent two different instance ids. These ids apply to the Function App and are not an indicator of specific functions. It’s likely that something changed in regard to the Function App (i.e. a start / top of the site, an update to a function, etc.) during this time that moved the Function App to a different instance. You’ll notice the execution counts in the screenshot below are both zero. All that means is for the time stamp in the screenshot (1:07 PM), there were no executions of functions within the Function App networknerd0.

But that’s only one source of data. We had many. So what does the big picture look like?
Dashboards are Nifty
As part of the integration, there are pre-built dashboards which give a bird’s eye view of what’s happening in our Azure Function environment. One way to find the one for Azure Functions is to go back to the Azure integration page, click on the Dashboards tab, and then click on the link next to Azure Functions. If you want a direct link, it should be https://addressofyourwavefrontinstance/dashboards/integration-azure-functions. Alternatively, we could have searched for it via the Dashboard menu and then select All Dashboards.

And here’s what we see. There’s only a single resource group inside my Azure subscription with 4 Function Apps inside, and this dashboard shows metrics for a rolling 2 hour window (refreshing as it receives data). One Function App contains no functions (networknerd1) and is not listed in the blue area because those numbers represent Function Apps whose functions have been executed in the rolling 2-hour window. Notice networknerd0 has the highest function execution count of the three Function Apps shown at 63. This count is an aggregate of all function executions for functions inside a Function App. Just looking at this data, we don’t know how many functions live inside each Function App.

Notice also networknerd2 is highlighted in the list of Function Apps. This highlights the lines on each of the charts below specific to networknerd2 and changes based on your selection. So if we move our cursor over the yellow lines on the IO Bytes / sec chart, we see data for just networknerd2. Do you notice something else there? This chart shows that the Function App networknerd1 was stopped shortly after 7 PM. In this case I manually stopped it, but a line similar to this one shows up on each chart for when Function Apps are started and stopped during the rolling window. By the way, pressing Shift + p as shown below will “pin” the value key for the chart on your screen at a specific point in time if needed for reference.

Here’s the event for networknerd2 starting again (shows when you hover your cursor over that time period on the chart).

On that same chart, if we move our cursor over a line that corresponds to a different Function App’s metrics, we would see that data instead of just data for networknerd2. Here’s an example. The data lines for other Function Apps were shown on the chart previously but not highlighted by default.

The Azure Functions Dashboard has 9 different charts altogether configured out of the box (shown below). We could potentially clone the entire dashboard and customize it or make our own based on specific metrics, so it’s important to know that this is only the beginning.

Icing on the Cake with CI / CD
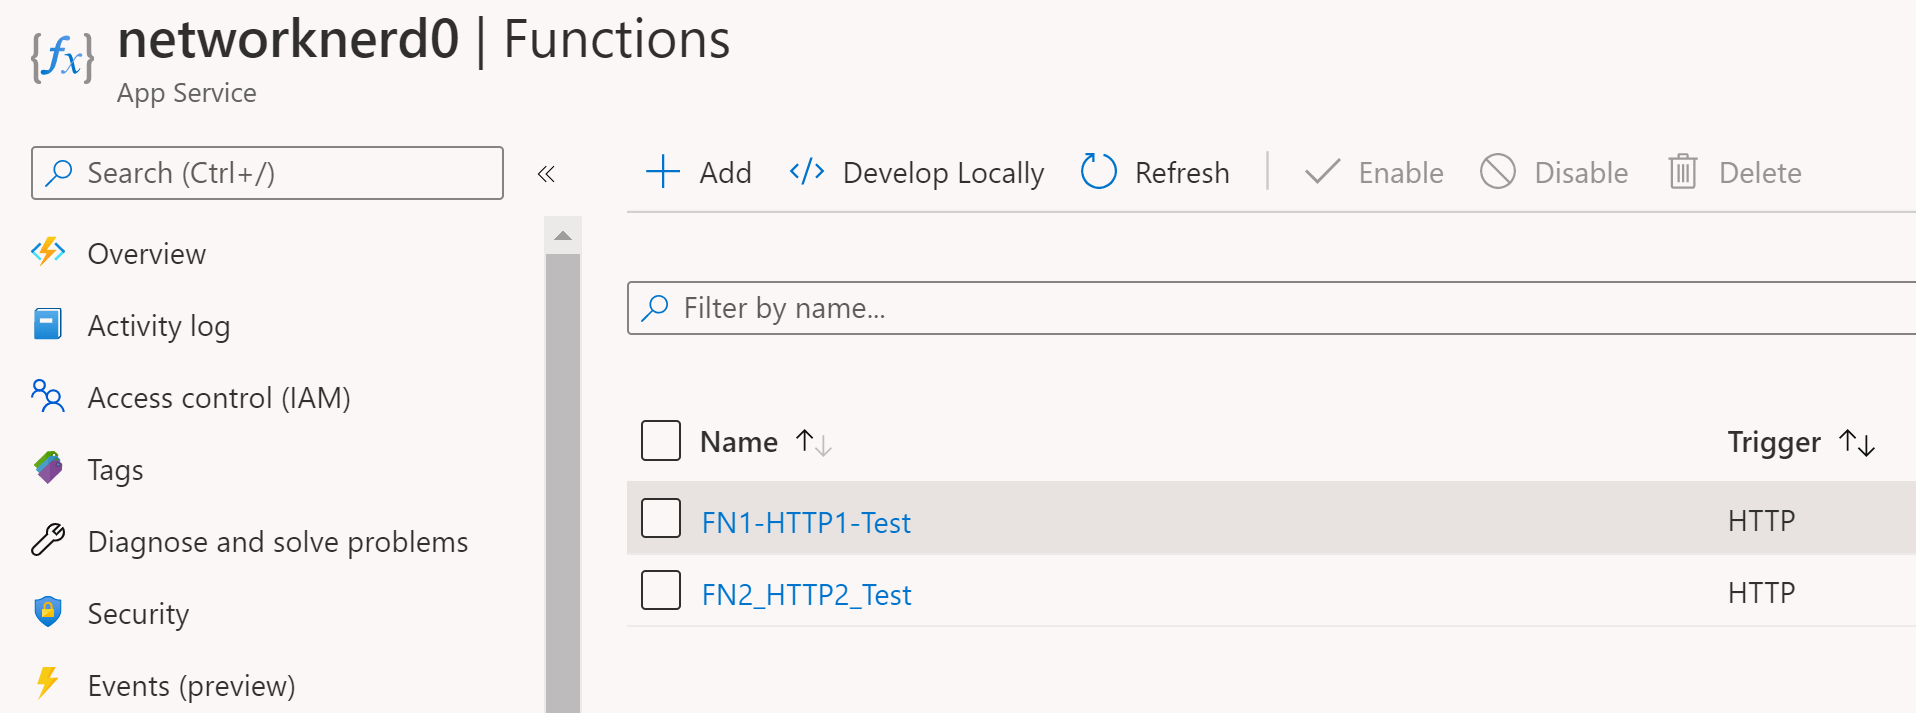
What if we go back to VS Code and create a new function that will be added to Function App networknerd3 and let Wavefront help us understand what happened? I created function FN-HTTP2-NN3 as shown here.

Then, since VS Code is connected to Azure Repos, commit and merge changes. Because of our work in the last post, this kicks of an automatic build pipeline, which can see succeeded.

And now, we check for a successful release (and have one).

If we go back to the Azure portal and check the Function App networknerd3, we see the new function.

At this point, I picked up the function URL for our newly added function and ran it 20 times to see what Wavefront could tell us. Wait a minute! Why do we have 4 Function Apps now? Well, this dashboard is showing a count of Function Apps with functions inside that have been executed within a specific time window. Once a new function was added to networknerd3, it showed up in the list at the top again with a different instance id (same friendly name but new instance id). The Function App was changed because we added a new function to it, but at present I don’t know why it was assigned a new instance id. You can also see the new networknerd3 has 20 function executions.

Notice something else really interesting in the above screenshot (close up view of this below). There’s an event on one of the charts that coincides with adding that new function (Get Web App Publishing Profile). If we hover our mouse toward the bottom of the chart, we see a new popup showing that there were 2 events at that time. We can pin it if we want or follow the link to see all the events.

Here’s what happens when we follow the link. It shows the two events happening at this time. They are tagged with azure:activitylogs automatically thanks to our integration. The time period on the left is adjustable as well, and that tag is searchable / clickable to see all events with that same tag in this window.

But did that event really happen twice? Check out this shot from the networknerd3 activity log in Azure. It looks like it was, and we can tell on the far right that the events were initiated by the Azure DevOps organization we setup in a previous post. That’s all for now. Until next time!

Other Posts in This Series
- Part 1 – A First Voyage into Azure Functions and Function Apps
- Part 2 – Deploying Azure Functions with Visual Studio Code
- Part 3 – Push and Pull – Using VS Code with Azure Repos
- Part 4 – Azure Functions and C# Code Intricacies – An Azure Pipelines Prequel
- Part 5 – From VS Code to Azure Pipelines – Basic CI/CD with Azure Functions
- Part 6 – This post
- Part 7 – Introduction to Distributed Tracing with Tanzu Observability and Azure Functions
- Part 8 – Coming soon!
Further Reading on Wavefront Integration
- Catch the Wave with GCP – A Wavefront Integration Exploration
- Creating a Wavefront Proxy in AWS
- Shipping Pi-hole Logs to a Wavefront Proxy
- Verifying Wavefront Proxy Log Ingestion
- Fishing for Wavefront Metrics with Grok Patterns
- Pi in the Sky: Using Wavefront to Analyze Pi-Hole Data