This is part 7 of my quest to explore Azure Functions for self-education in functions-as-a-service. The goal of this post is to successfully instrument an Azure function for OpenTracing to visualize the function call inside Tanzu Observability (AKA Wavefront).
Back in part 1, we explored Azure Functions and Function Apps via the Azure portal. In part 2 we explored deploying function code to Azure directly from VS Code. In part 3 we wired up VS Code with source control using Azure Repos but didn’t make it to Azure Pipelines. In part 4 we explored some differences in C# and C# script code that pop up when creating / editing Azure Functions in the Azure portal compared to leveraging VS Code which are foundational for getting Azure Pipeline settings correct. In part 5 we configured and tested basic CI/CD for Azure Functions using Azure Pipelines based on a code change to an Azure Repo. In part 6 we explored the integration of Tanzu Observability (AKA Wavefront) with Azure Functions. Now that we’ve reviewed the progress made thus far, let’s get to it!
Also in part 6, we looked at some metrics for several Function Apps but didn’t get down to metrics from within the functions themselves. In fact, since a Function App (which can contain one or more functions) is considered a Source as far as Wavefront is concerned, we can’t get that level of granularity out of the box. But, we can instrument our function code using a C# SDK that will provide some additional insight (using distributed tracing). This will generate additional metrics called RED Metrics. There are a few different SDKs for Wavefront, but we will focus on the one for OpenTracing.
Setting up Our Environment for Instrumentation
Per the GitHub page for Wavefront’s OpenTracing SDK for C#, in order to instrument our code, we need to install the proper NuGet package (latest version was 2.0.0 as of this article). As shown here within VS Code’s TERMINAL window, an attempt to add the package does not work after running the command from the NuGet site. 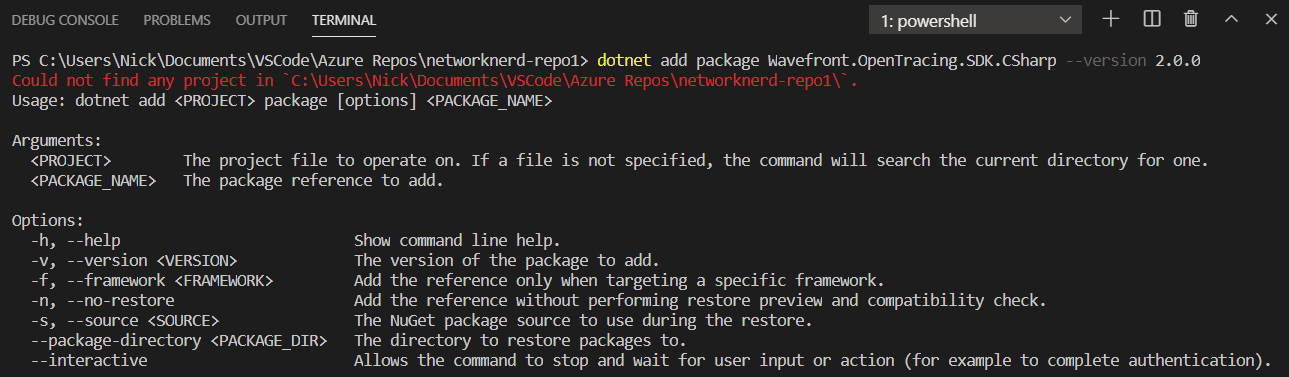
In this case, it’s not you. It’s me. It turns out there was no project file inside the directory shown above (C:\Users\Nick\Documents\VSCode\Azure Repos\networknerd-repo1). The local directory networknerd-repo1 is a cloned copy of our Azure Repo with the same name. That means the project file we showed in a previous post is down a couple of levels inside VS Code Testing\networknerd3. As shown here, once we change directories to the right place and re-run the command, we are off to the races!
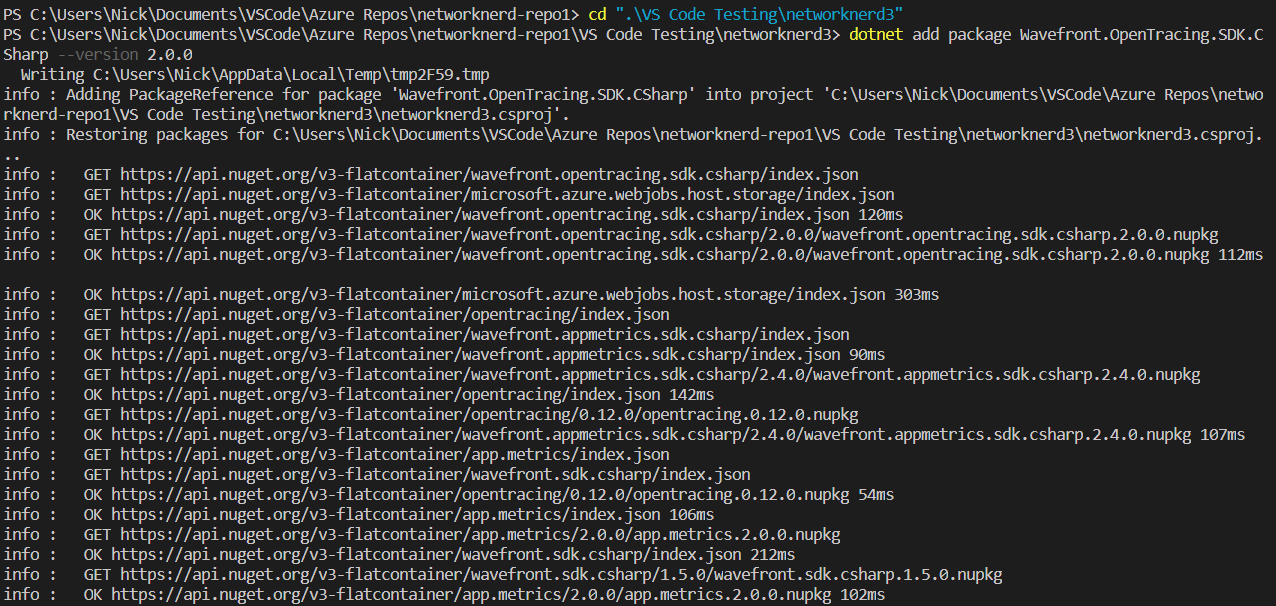
Toward the end of the install, there were some warnings, but this screen capture and subsequent text output was the most important part shown in the terminal window. That means the package install was a success and is compatible with our current project file (networknerd3.csproj).
![]()
info : Package 'Wavefront.OpenTracing.SDK.CSharp' is compatible with all the specified frameworks in project 'C:\Users\Nick\Documents\VSCode\Azure Repos\networknerd-repo1\VS Code Testing\networknerd3\networknerd3.csproj'.
info : PackageReference for package 'Wavefront.OpenTracing.SDK.CSharp' version '2.0.0' added to file 'C:\Users\Nick\Documents\VSCode\Azure Repos\networknerd-repo1\VS Code Testing\networknerd3\networknerd3.csproj'.
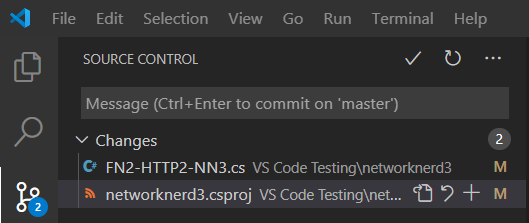
Taking a look at the source control area inside VS Code, we see two files changed. I created a new HTTP Trigger function called FN2-HTTP2-NN3 (see this post for steps to create a function in VS Code using the plugin for Azure Functions), so seeing the .cs file is an expected change. From the output message above, there was also a package reference for our OpenTracing SDK added to the project file networknerd3.csproj.
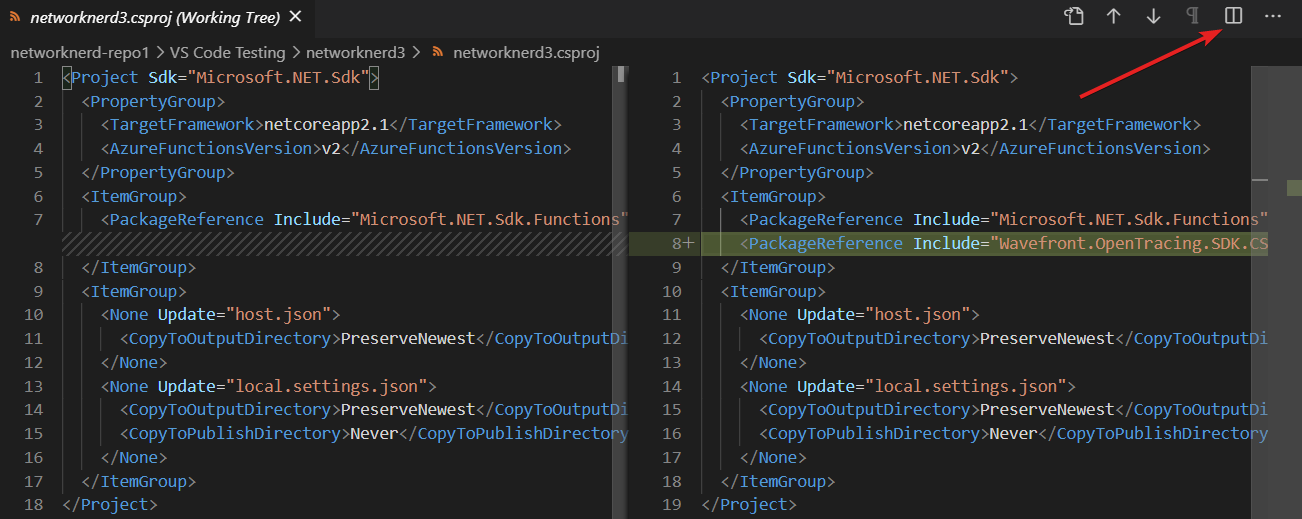
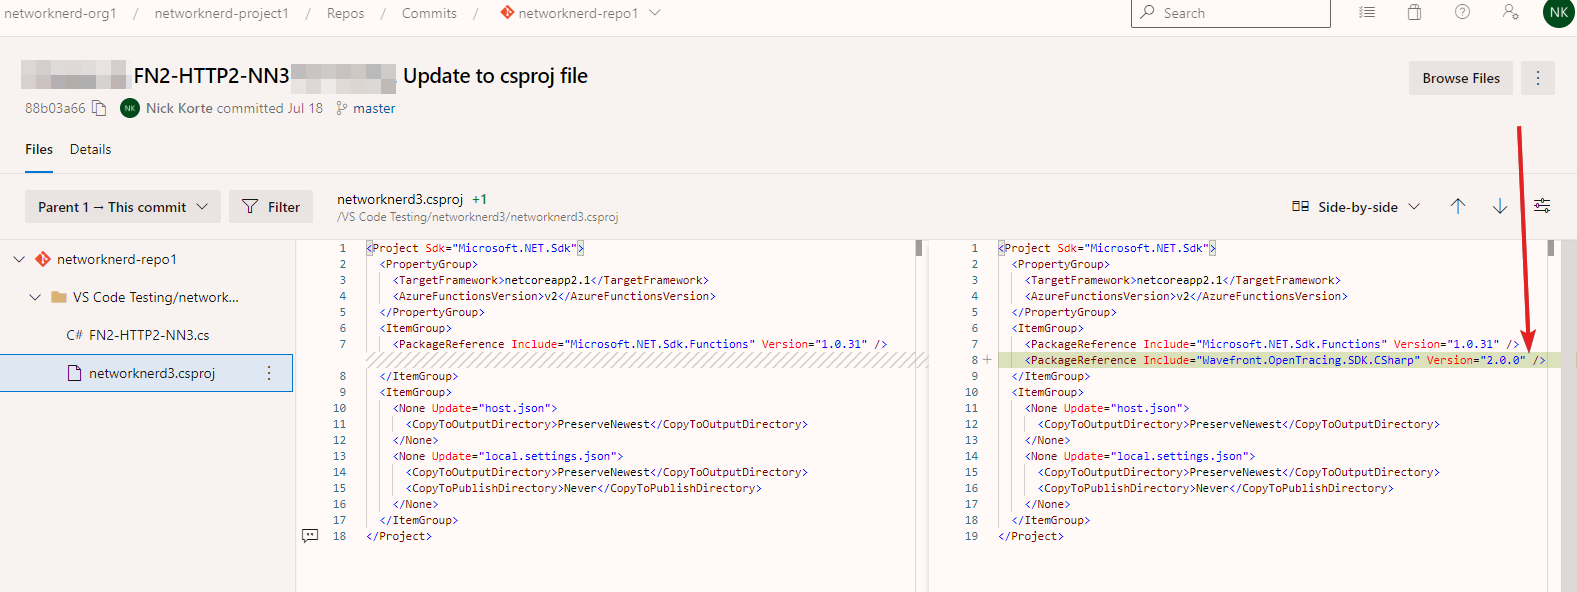
Let’s see where that package reference got inserted in networknerd3.csproj. After selecting the project file as shown above, click on the Split Editor button. As shown in the right-hand pane below, the newly added line of code is highlighted to visualize changes. If the changes to this project file were committed to our Azure Repo along with the function code change mentioned earlier, the NuGet steps that run during the Azure Pipelines build jobs should understand the new package reference and be able to successfully run a build for code that contains a reference to any construct defined in the SDK.
If you’re following along and want to verify these changes don’t break anything, I encourage you to do a local commit and synchronize changes to confirm that everything still works as far as our Azure Pipelines go. You’ll notice here we can look at our Commit activity to see what changed by visiting Repos -> Commits -> networknerd-repo1 in our Azure DevOps project and selecting the specific commit. There are two files in this commit just like we would expect, and we see below that our new version of networknerd.csproj has the added package reference.
The build and release pipelines did execute successfully in this case, and I verified our new function showed up inside the Function App networknerd3 and could be executed successfully (steps not shown here).
Getting an API Key for Direct Metric Ingestion
It’s one thing to reference a SDK within your code’s project file but yet another to leverage it. While the documentation is decent, I struggled with this part for a while. Even though the language shown in this post is C#, hopefully it will help anyone trying to get started with instrumenting their code for tracing. I started by following the examples shown here for creating a WavefrontTracer object. As the document page says, this object sends traces and spans to the Wavefront platform either by ingesting them at a proxy first or by sending to the Wavefront platform directly via direct ingestion. As you will see, I used direct ingestion to make this simpler. For direct ingestion to work, we need the API key for our Wavefront instance.
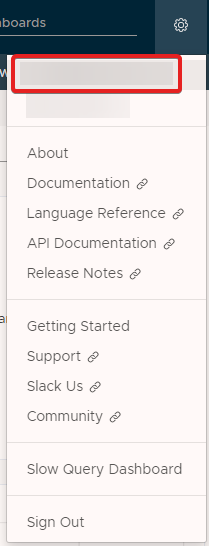
After logging into the Wavefront interface, click the cog icon in the upper right. Then, click on your e-mail address in the dropdown menu to go to your profile (e-mail address sanitized in the screenshot below).
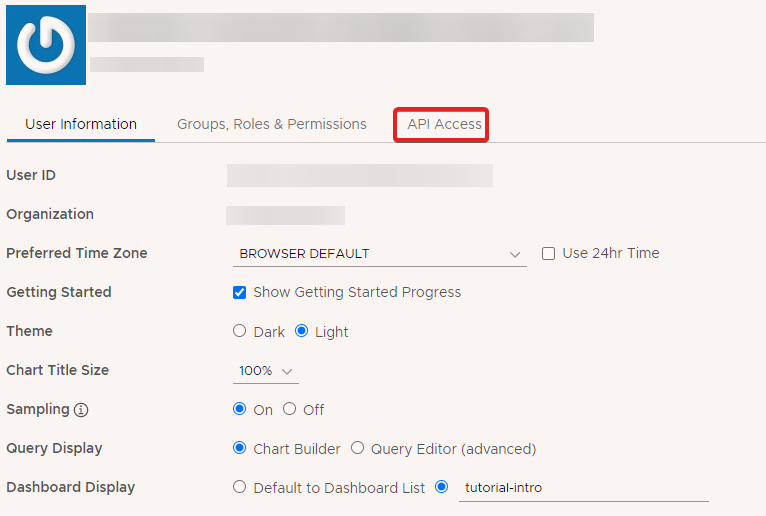
From here, we see our user id and organization as well as a few preferences (i.e. dark mode vs. light mode). Click on the API Access option.
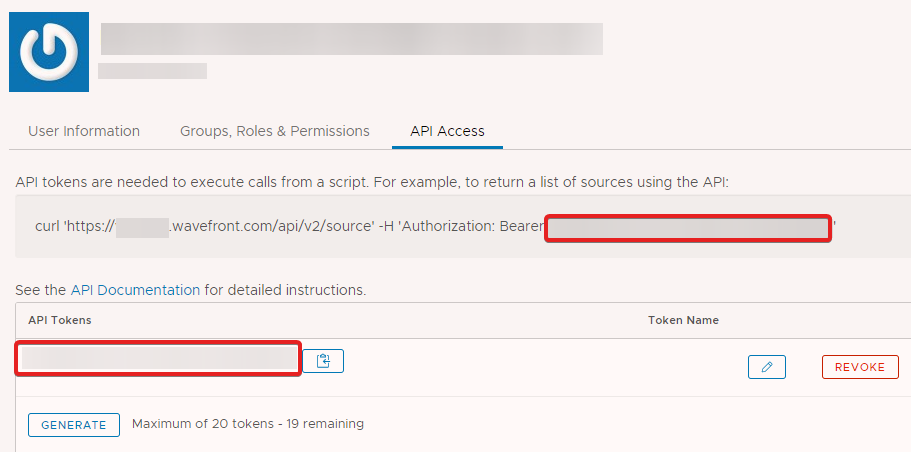
The API token will show up where the red boxes are in the below screenshot. It looks like we can have up to 20 different tokens here. Only 1 is needed for our purposes. Part of the https address is santized to avoid confusion as the address will be unique for each company leveraging the Wavefront service.
Now that we have the API key ready, let’s begin coding.
Instrumenting a Function’s Code
If we assume the function FN1-HTTP1-NN3 has just been created using the HTTPTrigger template in VS Code (see this post for step-by-step instructions), the code output inside FN1-HTTP1-NN3.cs is as follows:
using System;
using System.IO;
using System.Threading.Tasks;
using Microsoft.AspNetCore.Mvc;
using Microsoft.Azure.WebJobs;
using Microsoft.Azure.WebJobs.Extensions.Http;
using Microsoft.AspNetCore.Http;
using Microsoft.Extensions.Logging;
using Newtonsoft.Json;


namespace NetworkNerd.Functions
{
    public static class FN1_HTTP1_NN3
    {
        [FunctionName("FN1_HTTP1_NN3")]
        public static async Task Run(
            [HttpTrigger(AuthorizationLevel.Function, "get", "post", Route = null)] HttpRequest req,
            ILogger log)
        {
            log.LogInformation("C# HTTP trigger function processed a request.");

            string name = req.Query["name"];

            string requestBody = await new StreamReader(req.Body).ReadToEndAsync();
            dynamic data = JsonConvert.DeserializeObject(requestBody);
            name = name ?? data?.name;

            string responseMessage = string.IsNullOrEmpty(name)
                ? "This HTTP triggered function executed successfully. Pass a name in the query string or in the request body for a personalized response."
                : $"Hello, {name}. This HTTP triggered function executed successfully.";


            return new OkObjectResult(responseMessage);
        }
    }
}
Now, let’s look at that same functions code after being instrumented with the OpenTracing SDK and see how it looks different. I’ve included comments inside the code to help those who want to do this on their own understand the steps. I also posted some code snippets on GitHub.
using System;
using System.IO;
using System.Threading.Tasks;
using Microsoft.AspNetCore.Mvc;
using Microsoft.Azure.WebJobs;
using Microsoft.Azure.WebJobs.Extensions.Http;
using Microsoft.AspNetCore.Http;
using Microsoft.Extensions.Logging;
using Newtonsoft.Json;

//Added these so code would work
using Wavefront.SDK.CSharp.Common.Application;
using Wavefront.SDK.CSharp.Common;
using Wavefront.OpenTracing.SDK.CSharp.Reporting;
using Wavefront.OpenTracing.SDK.CSharp;
using Wavefront.SDK.CSharp.DirectIngestion;

namespace NetworkNerd.Functions
{
    public static class FN1_HTTP1_NN3
    {
        [FunctionName("FN1_HTTP1_NN3")]
        public static async Task Run(
            [HttpTrigger(AuthorizationLevel.Function, "get", "post", Route = null)] HttpRequest req,
            ILogger log)
        {

            //Begin code instrumentation - reference https://github.com/wavefrontHQ/wavefront-opentracing-sdk-csharp
            //Application, service, and cluster variables are for building application tags.
            //The URL and token are for direct ingestion access.  Parameters for using a proxy might be slightly different.
            string application = "TestApp1";
            string service = "TestService1";
            string cluster = "networknerd3";

            //This URL should be unique to your company's Wavefront instance and has been sanitized in this code sample.
            string wfURL = "https://yourcompany.wavefront.com";

            //This token is unique to your instance of Wavefront and has been sanitized in this code sample.  Login to your instance and navigate to your user profile (cog icon in upper right -> click your e-mail address).  Then click the API Access option.
            string token = "xxxxxxxx-xxxx-xxxx-xxxx-xxxxxxxxxxxxx";

            //Create ApplicationTags based on above parameters.
            //The commmand below adds the optional cluster field so it shows up inside Wavefront.
            ApplicationTags applicationTags = new ApplicationTags.Builder(application, service).Cluster(cluster).Build();

            //Initialize WavefrontDirectIngestionClient
            WavefrontDirectIngestionClient.Builder wfDirectIngestionClientBuilder =  new WavefrontDirectIngestionClient.Builder(wfURL, token);

            // Create an IWavefrontSender instance for sending trace data via direct ingestion.
            IWavefrontSender wavefrontSender = wfDirectIngestionClientBuilder.Build();

            //Create a WavefrontSpanReporter for reporting trace data that originates on .  We're using the function name in this case as the source.  This will show up as a source for metrics inside the Wavefront interface.
            IReporter wfSpanReporter = new WavefrontSpanReporter.Builder().WithSource("FN1_HTTP1_NN3").Build(wavefrontSender);

            //Create the WavefrontTracer.
            WavefrontTracer MyTracer = new WavefrontTracer.Builder(wfSpanReporter, applicationTags).Build();

            //Start building a new span called FN1_HTTP1_NN3.Execute
            OpenTracing.IScope scope = MyTracer.BuildSpan("FN1_HTTP1_NN3.Execute").StartActive();

            log.LogInformation("C# HTTP trigger function processed a request.");

            string name = req.Query["name"];

            string requestBody = await new StreamReader(req.Body).ReadToEndAsync();
            dynamic data = JsonConvert.DeserializeObject(requestBody);
            name = name ?? data?.name;

            string responseMessage = string.IsNullOrEmpty(name)
                ? "This HTTP triggered function executed successfully. Pass a name in the query string or in the request body for a personalized response."
                : $"Hello, {name}. If you see this message, your build and release pipelines for FN1-HTTP1-NN3 have updated the function's code successfully.";

            //Dispose of the scope object.
            scope.Dispose();

            //Close the tracer before application exit and flush all buffered spans to Wavefront.
            MyTracer.Close();


            return new OkObjectResult(responseMessage);
        }
    }
}
Pause here, and we’ll do a quick analysis of the newly instrumented function’s code.
- Lines 1-9:
- Look at the first section containing using statements. The first 9 lines remain the same as they were in the previous code block.
- Lines 10-16:
- Additional using statements had to be added so that objects, methods, and properties from within the SDK could be referenced in a more readable way. The SDK documentation does not mention these are needed. Thankfully, the code actions / quick fixes within VS Code added these for me to eliminate errors in the code.
- Lines 17-26:
- There’s nothing new to see here. These lines of code are the same as in the previous code block.
- Lines 27-43:
- These lines instantiate the first of a few objects needed to create the WavefrontTracer object mentioned previously and add the metadata for our trace.
- The application and service variables represent the name of the application as it will show up in the Wavefront tracing interface and the service name within that application to which we are applying tracing and will show up as tags that can be used inside Wavefront for analysis. In the microservices world, one application is likely made up of many services. I chose an application name of TestApp1 and a service name of TestService1.
- Notice there is also a variable named cluster that is set to networknerd3 (the name of our Function App on the Azure side where this function lives). Per the ApplicationTags documentation page, the cluster tag is something additional we can add to enrich the tracing data. I added it here as a way to map this trace back to the Function App. The variable containing a value for the cluster tag could have been named anything, so don’t let that confuse you.
- Line 36 is the address of our Wavefront instance, and line 39 is the API token we captured earlier for direct ingestion.
- In line 43, we build an ApplicationTags object contacting our application name, service name, and cluster name.
- Lines 44-56:
- Line 46 creates a WavefrontDirectIngestionClient object with the URL and token from earlier, identifying the instance to which we will send metrics.
- Line 49 builds an IWavefrontSender object using our chosen method of direct ingestion.
- Line 52 creates the IReporter object to report trace data based on a custom source. Notice I chose to use the function name here as the source name. This will appear as a Source for metric collection inside the Wavefront interface.
- Finally in line 55 we create the WavefrontTracer object and use some of the previously created objects as parameters.
- Lines 57-59:
- After reading the documentation, one might think building the WavefrontTracer is all that is needed and that we’re good. But that is far from the truth. We need to build a span, which is supposed to represent a unit of work done in a distributed system. It’s an operation we are timing and tracking, which in our case, is the function execution. There can be as many spans as we want inside this function, but let’s start with one. The span can be named whatever we want, but I chose FN1_HTTP1_NN3.Execute. We’ll see where this shows up inside Wavefront a little later. What we will later see is in the form of traces. Each trace can be made up of one or more spans. See this doc page for a deeper explanation.
- Lines 60-71:
- There’s nothing new to see here (all the same as before).
- Lines 72-77:
- We dispose of the IScope object and then close the WavefrontTracer. This closing operation is what sends the span data to Wavefront.
Checking Our Work
How do we know at this point if instrumenting the function didn’t cause any weird errors? We could have done a function build inside VS Code to verify everything works after instrumenting and before pushing up to Azure. For steps on that local build process, see this post. For our purposes here, assume the code has been pushed up to Azure and successfully released so that our newly instrumented function is live. I executed the function FN1-HTTP1-NN3 9 consecutive times (steps to execute the function not shown here) before moving forward and did not add any additional parameters on each execution. Let’s see what happens on the Wavefront side.
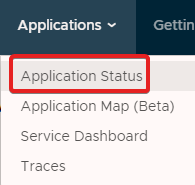
Inside the Wavefront interface, go to Applications -> Application Status.
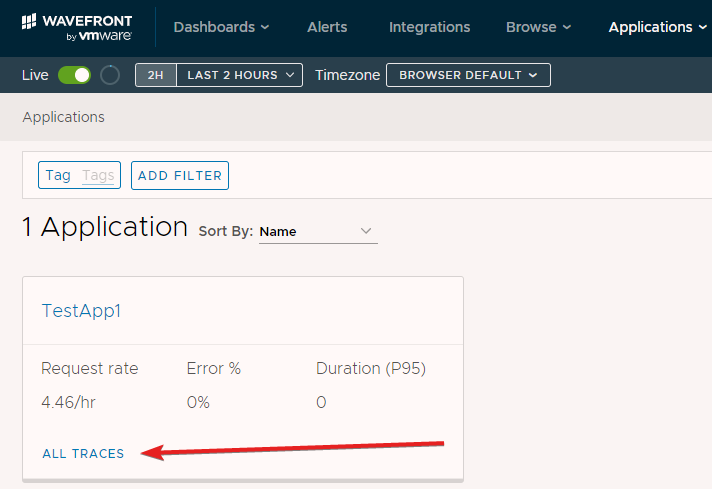
It looks like we have something here. We see one application named TestApp1, which matches the metadata specified in our code (line 31 from the instrumented code snippet above). Click on ALL TRACES to explore further.
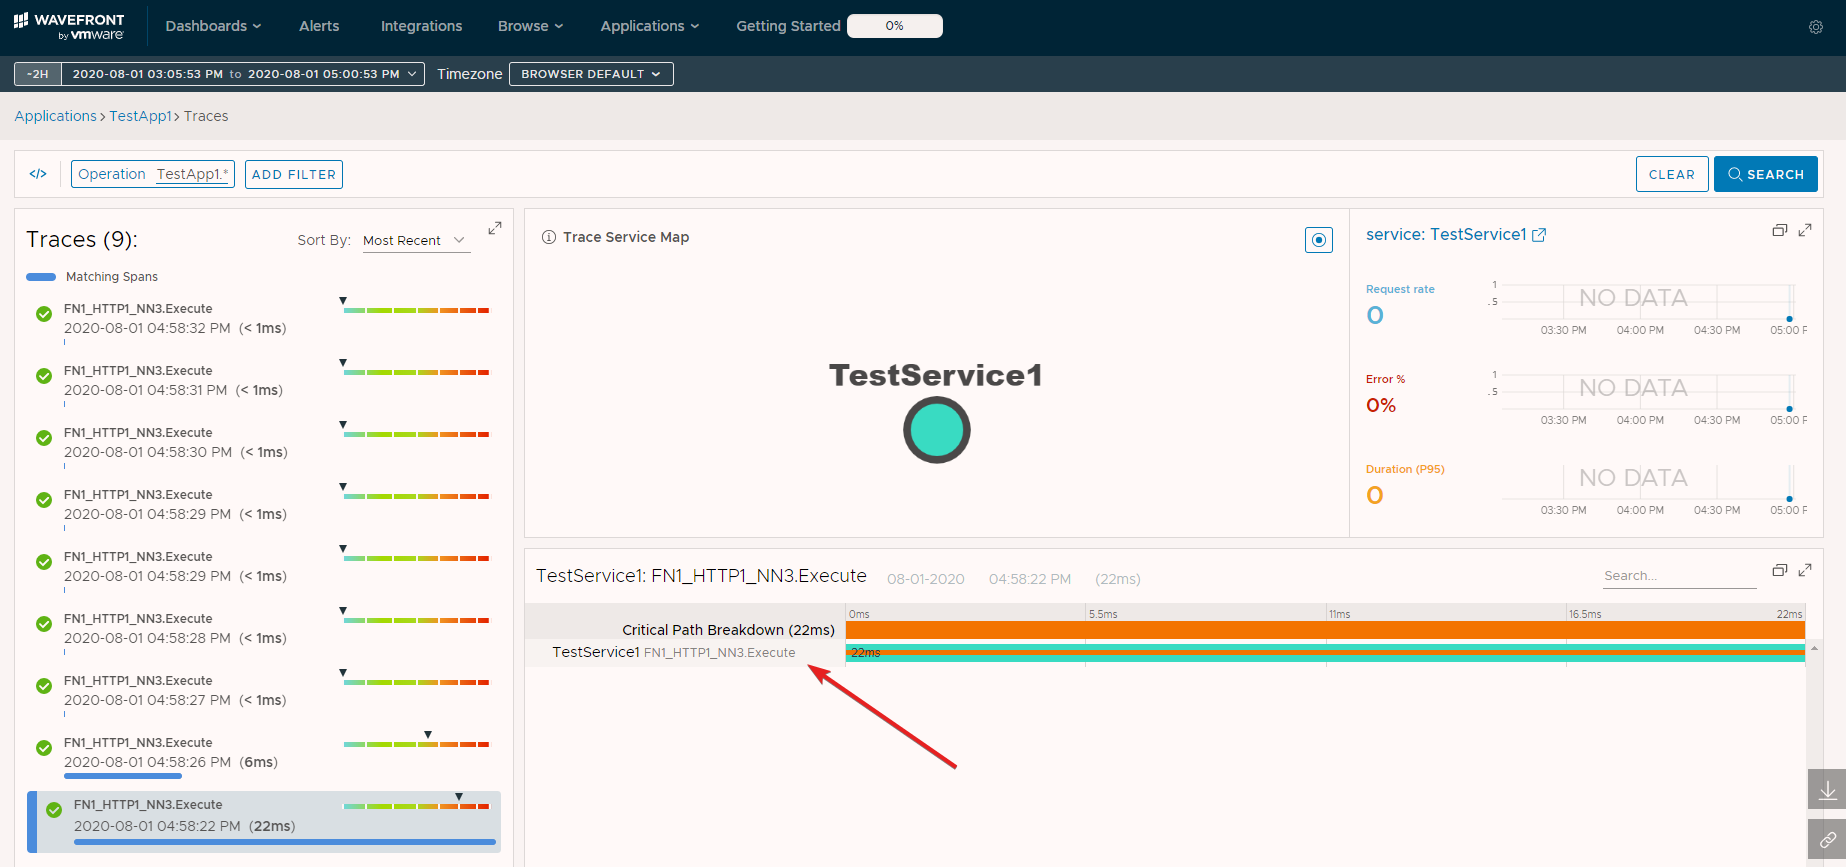
Notice we see 9 traces shown here. That is 9 spans, one from each function execution. The service name shown for each trace representation is TestService1 as we would expect (line 32). The name of each span shown is FN1_HTTP1_NN3.Execute just as was specified in our code shown previously (line 52). You’ll also notice the difference in the execution time. The first execution took 22ms and the second 6ms. Every subsequent execution took less than 1 ms. How can we explain this? Well, for purposes of this lab environment in Azure, I’m using the Consumption Plan for Azure Functions (see this post for where this gets selected in the Azure portal). The longer execution time in the beginning can be attributed to a cold start. There are no warm instances on the back end like with the Premium Plan. Suppose we dig into the details by clicking on the span name.
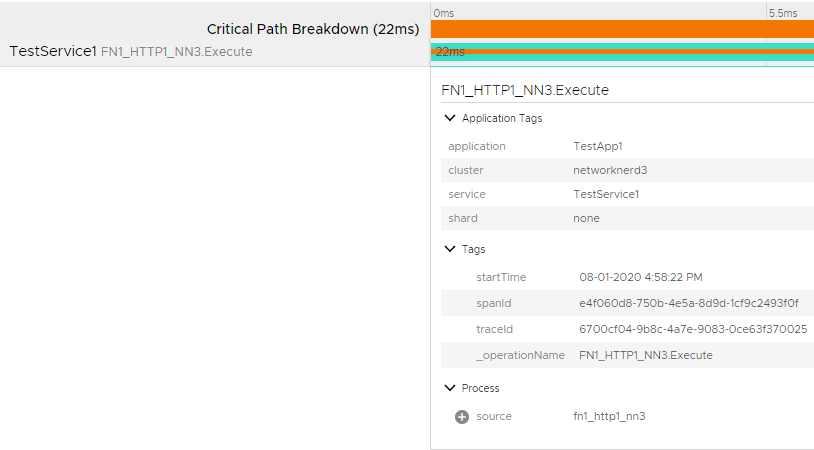
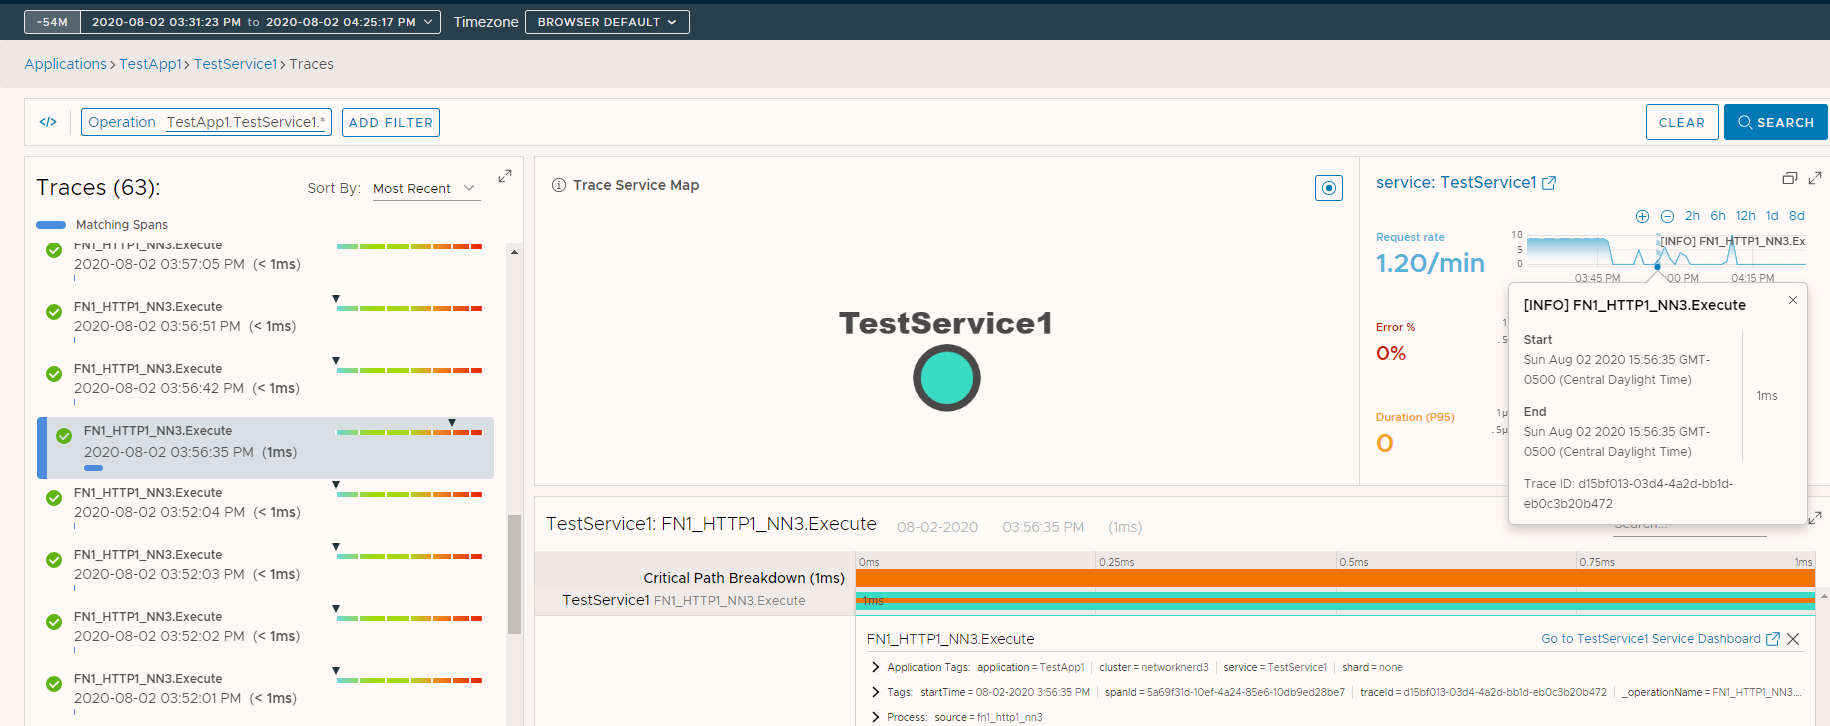
Notice the application tags are exactly what was specified in our code as is the source. The start time is captured automatically as part of the WavefrontTracer object in our code. The spanID and traceID are unique identifiers, and _operationName (or name of the span) is custom metadata from our code (line 58). Look at the details of a different trace in the list to compare.
Digging a Little Deeper
Suppose we allow more time to pass and execute our function several more times. The screenshot below is focused on one specific trace for TestService1. Notice on the Request rate chart for this service we can see exactly when this specific function execution happened. That chart is adjustable just as we showed in this post (can zoom in / out on the window of data shown). There’s nothing abnormal to see here since normal execution for this specific function should be extremely quick.
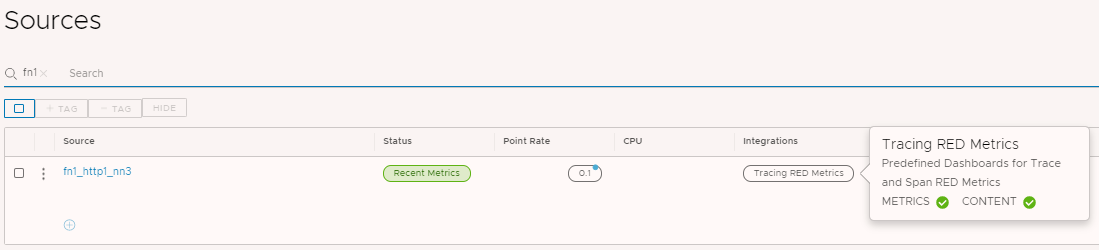
Remember that source tag we set earlier? If we go to Browse -> Sources we can search for and successfully find fn1_http1_nn3 as a Wavefront source for metrics, which maps to the name of the Azure Function we instrumented. Notice it automatically shows to be using the Tracing RED Metrics integration (a byproduct of the OpenTracing SDK). The green check for METRICS means that metrics are being received successfully, and the check next to CONTENT means the dashboards for Tracing RED Metrics are installed. What happens if we click on fn1_http1_nn3?
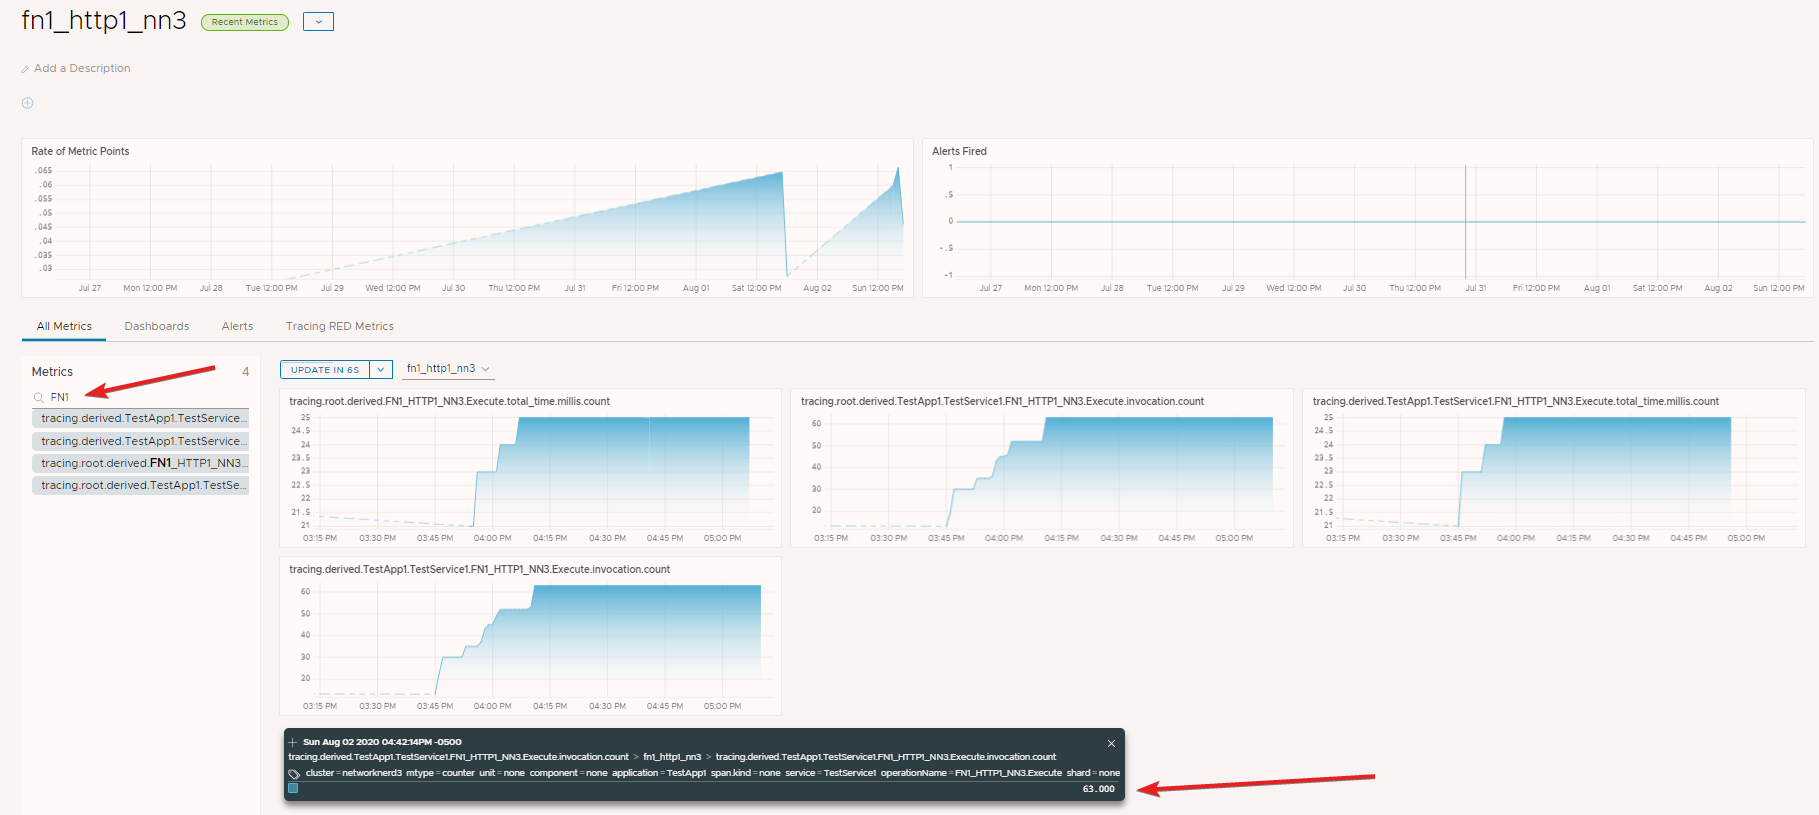
There are several metrics collected from our source fn1_http1_nn3, and all are related to the span FN1_HTTP1_NN3.Execute. Notice the invocation.count metric for this time window matches the total number of traces we saw earlier (63).
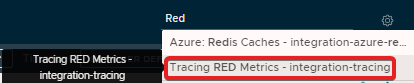
People like pretty dashboards, so let’s see what the ones for Tracing RED Metrics look like. We can get there from the Dashboard menu, select All Dashboards, and do a search, or use the dashboard search option in the upper right corner of our browser as shown here.
![]()
And here we have it. We see trends of request rate over time, successful requests, and a few other items. Notice the top requests are from FN1_HTTP1_NN3.Execute (the span name we’ve been using), and that there were a total of 63 function executions during this time window. The average execution time is 0.40ms during this time window. In both charts, FN1_HTTP1_NN3.Execute is clickable and will take us back to the tracing area. As for reasons why the other charts did not populate with data, it has to do with the way RED Metrics are derived and reported combined with the fact that we’re in a serverless environment.
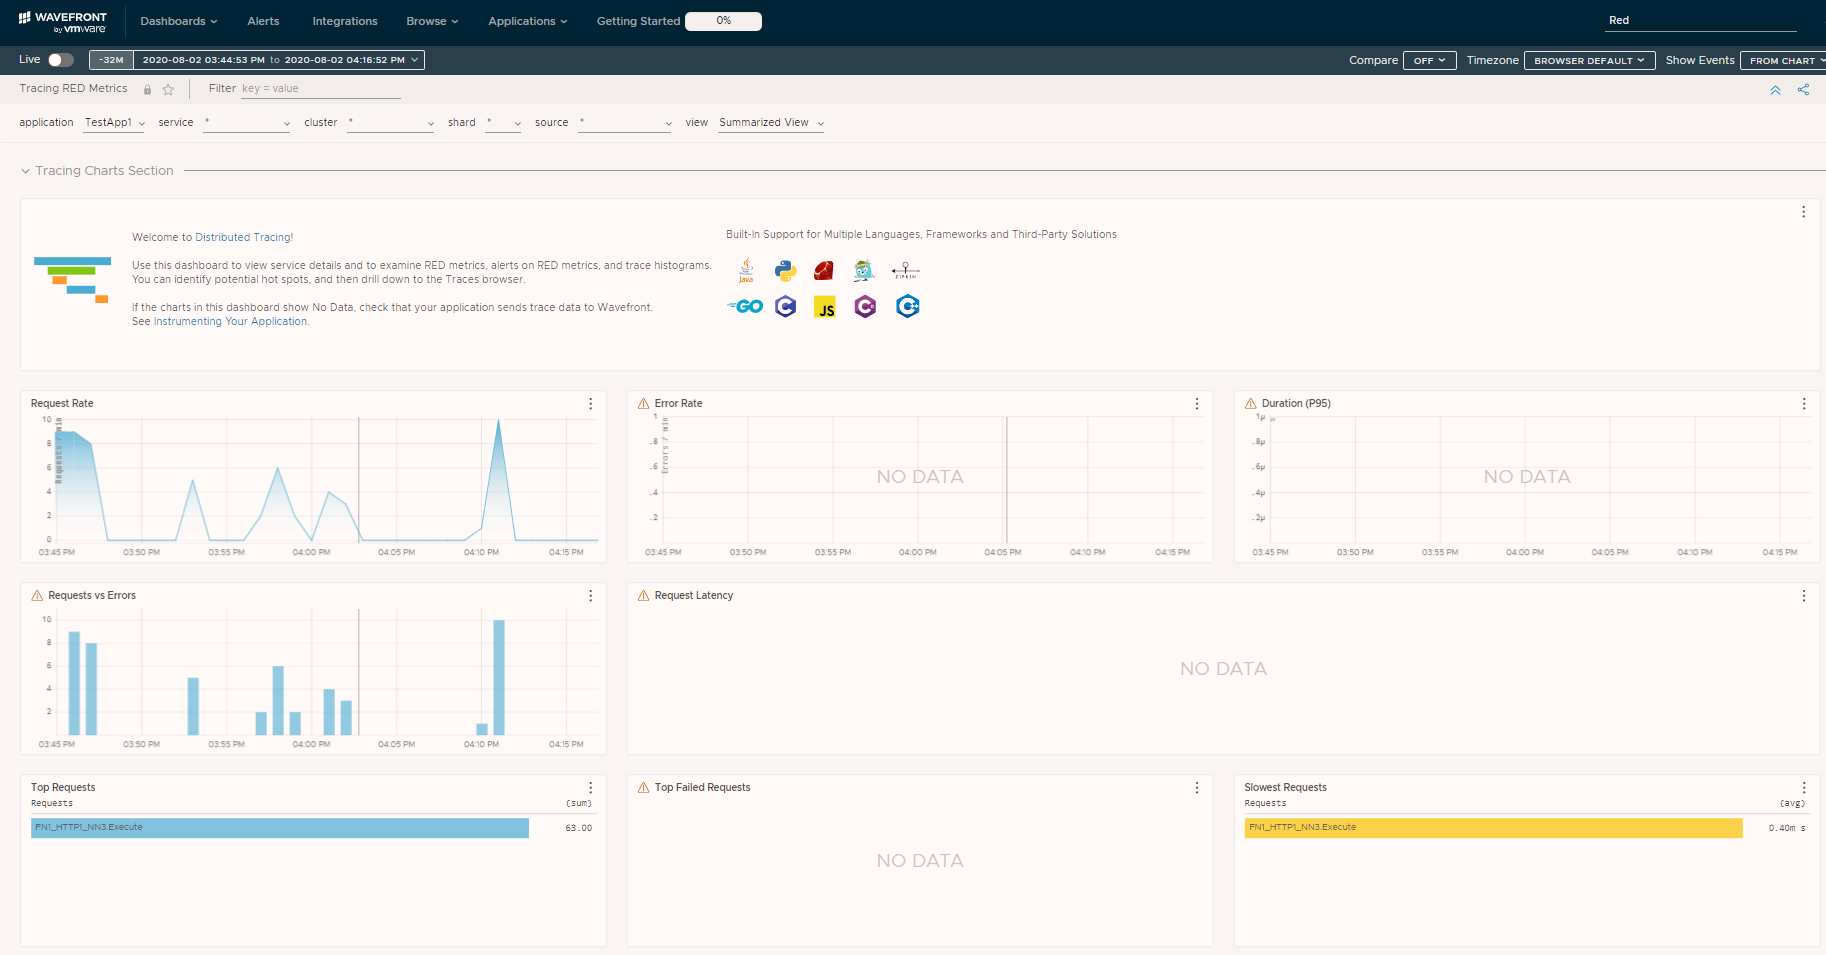
The view shown above is a canned dashboard (not customized). If there were traces coming from different sources or spans with different names than what we instrumented earlier, we would see multiple lines on the requests graphs only if we changed from Summary View to Detailed View. But, we instrumented only a single function. This dashboard could have been filtered by application, service, source, etc. if we had wanted.
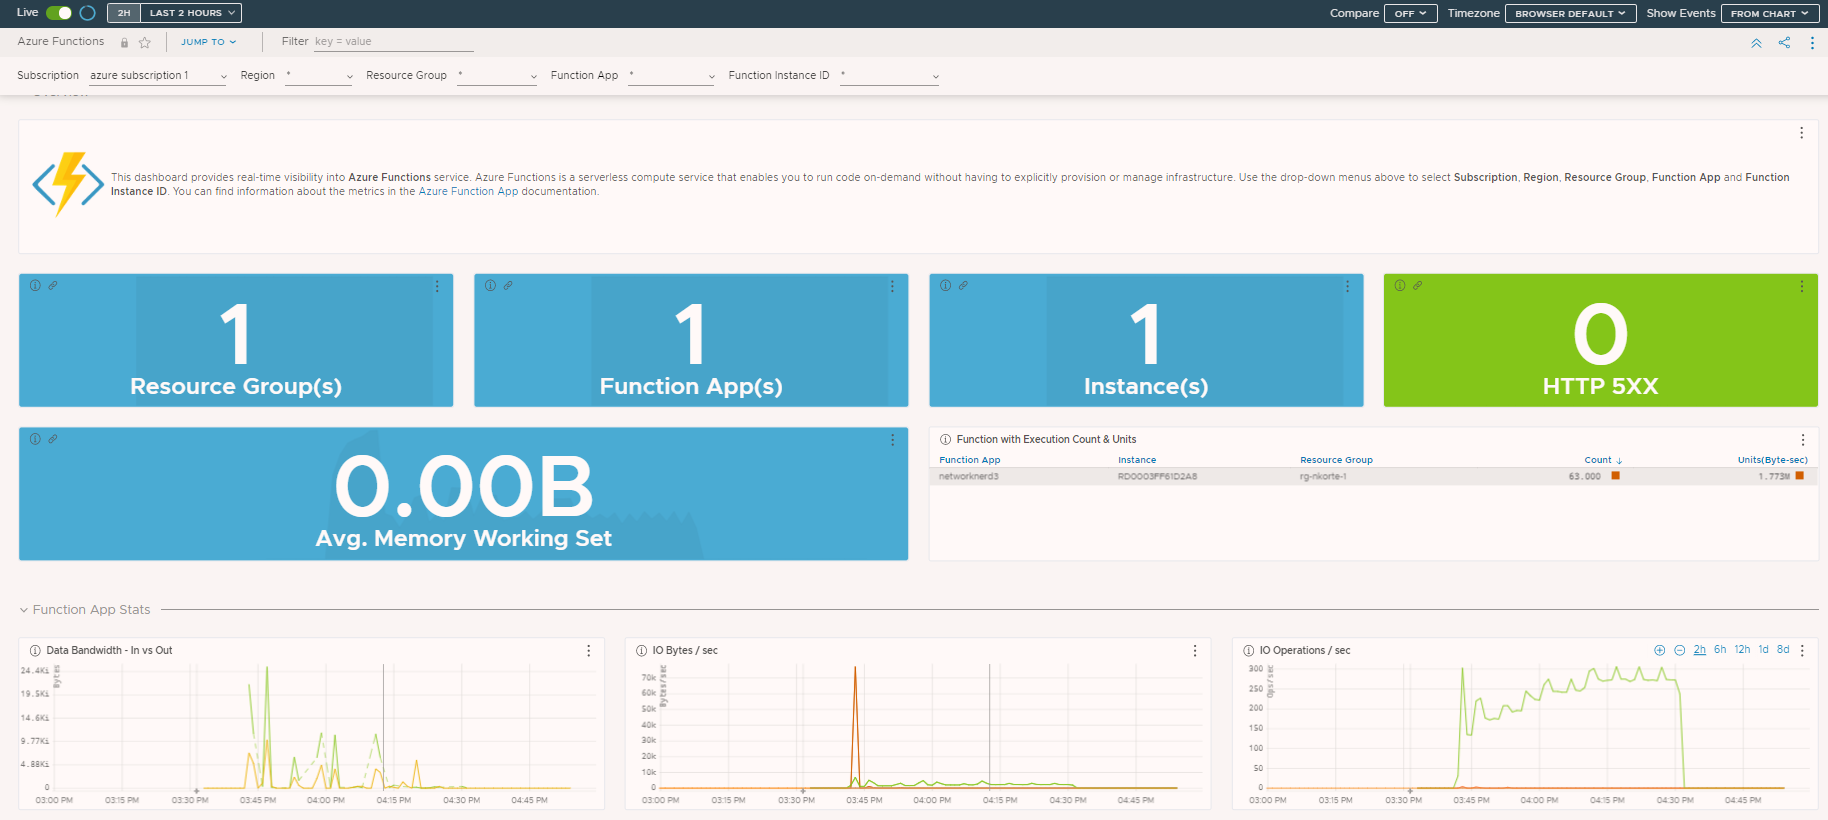
Let’s check one more thing. If we go back to the Azure Functions Dashboard discussed last time, you can see the 63 function executions all coming from the Function App networknerd3. We know because of our tracing exercise earlier and looking at our source fn1_http1_nn3 that all 63 were produced by one specific function.
Perhaps at this point you’re questioning the usefulness of distributed tracing in a serverless environment. While this is an introduction, and we have not shown much, consider this VMworld 2020 session in which my colleague Mark Foley shows off distributed tracing from his home lab running Kubernetes to my Azure Functions lab. We’ll continue the distributed tracing learnings with Azure Functions specifically in the next post.
Other Posts in This Series
- Part 1 – A First Voyage into Azure Functions and Function Apps
- Part 2 – Deploying Azure Functions with Visual Studio Code
- Part 3 – Push and Pull – Using VS Code with Azure Repos
- Part 4 – Azure Functions and C# Code Intricacies – An Azure Pipelines Prequel
- Part 5 – From VS Code to Azure Pipelines – Basic CI/CD with Azure Functions
- Part 6 – The Next Wave: Exploring Tanzu Observability’s Integration with Azure Functions
- Part 7 – This post
- Part 8 – Coming soon!